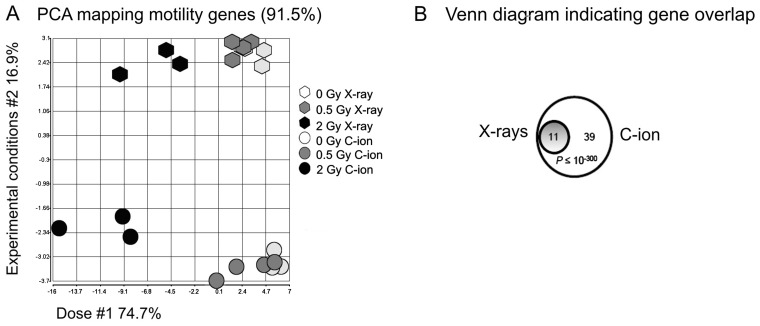
Figure 5.
Radiation-induced changes in motility related gene expression. (A) Principal component analysis (PCA) of motility genes revealed distinct clusters similar to global PCA analysis. The percent variability is ∼91.5% explained by the components dose (74.7%) and experimental conditions (16.9%). (B) Venn diagram showing the overlap of motility genes differentially expressed after 2.0 Gy irradiation. All genes found to be differentially expressed by 2.0 Gy X-rays were also regulated by 2.0 Gy carbon ion irradiation.

