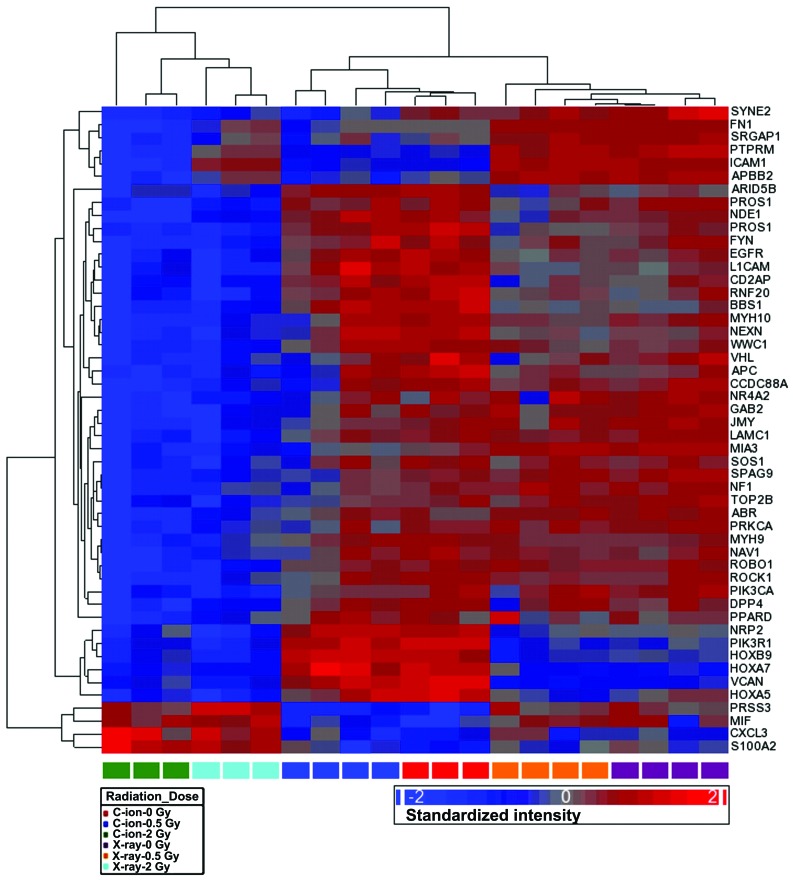
Figure 6.
Heat map of the hierarchical clustering for the 50 motility genes which were significantly regulated by 2.0 Gy carbon ion irradiation. First hierarchical separation distinguished samples irradiated with 2.0 Gy on the left of the heat map. Out of the remaining samples, two groups can be distinguished based on beam quality [carbon ions (middle) vs. X-ray (right)].

