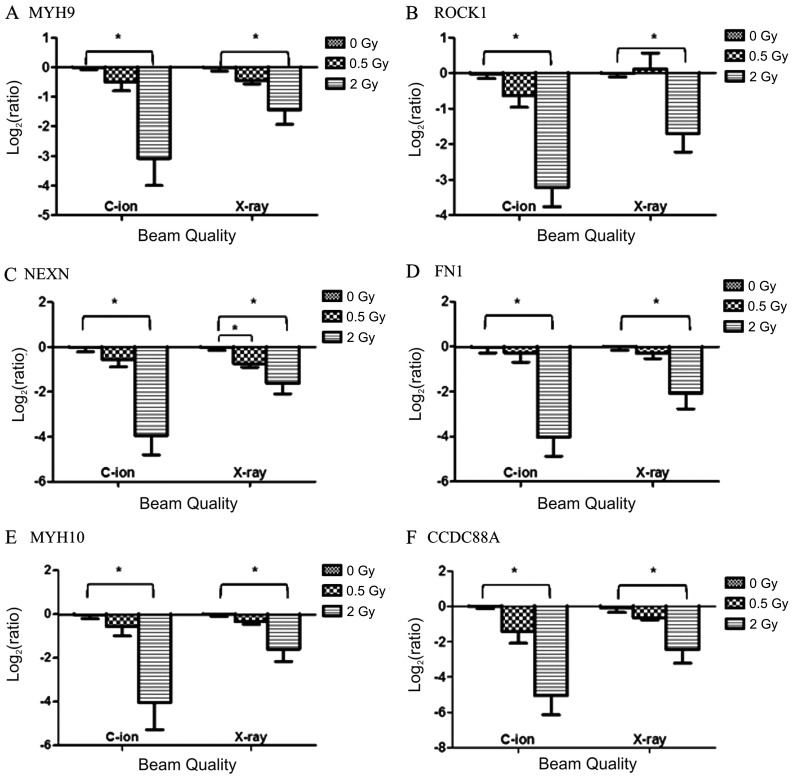
Figure 7.
Relative gene expression changes of six selected motility genes 8 h after carbon ion or X-irradiation. Log2(ratio) of the expression of (A) MYH9, s(B) ROCK1, (C) NEXN, (D) FN1, (E) MYH10 and (F) CCDC88A is presented. Significantly altered gene expression compared to CTRL samples (*P≤0.05) based on one-tailed Mann-Whitney tests. RT-qPCR results confirm the downregulation observed by microarray analysis after radiation which was more pronounced after carbon ion radiation when compared to X-rays.

