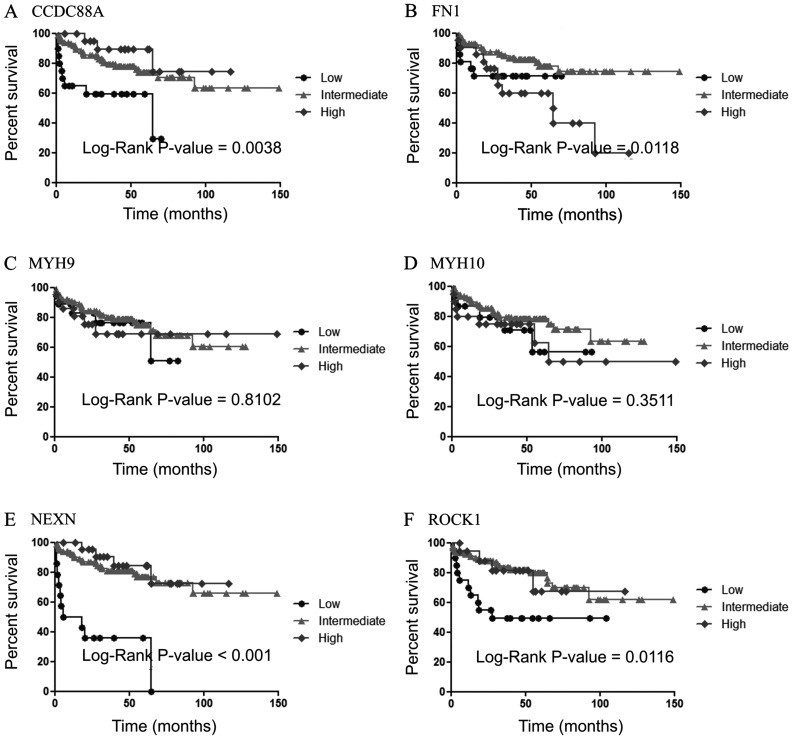
Figure 8.
Kaplan-Meier survival analysis of (A) CCDC88A, (B) FN1, (C) MYH9, (D) MYH10, (E) NEXN and (F) ROCK1 gene expression performed on the data set of Taylor et al (48). Tumor samples were divided into three groups based on whether the gene expression value was high (♦, dark grey); intermediate (▴, light grey); or low (•, black). Differences in survival were found to be significant for CCDC88A, FN1, NEXN and ROCK1 when log-rank P≤0.05.

