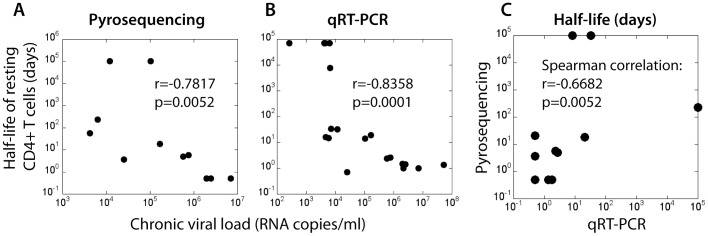
Figure 3. Half-life of resting CD4+ T cell SIV DNA decreases with increasing chronic plasma viral load.

The chronic plasma viral load (geometric mean viral load from day 100 post-infection) is significantly negatively correlated with the estimated half-life of SIV DNA for each animal. Half-life estimated using (A) pyrosequencing data (Spearman correlation, r = −0.7817, p = 0.0052) and (B) KP9-specific q-RT-PCR data (Spearman correlation, r = −0.8358, p<0.0001). C. Half-life estimations' (days) using pyrosequencing compared to the KP9-specific qRT-PCR are significantly correlated (Spearman correlation, r = 0.6682, p = 0.0297).
