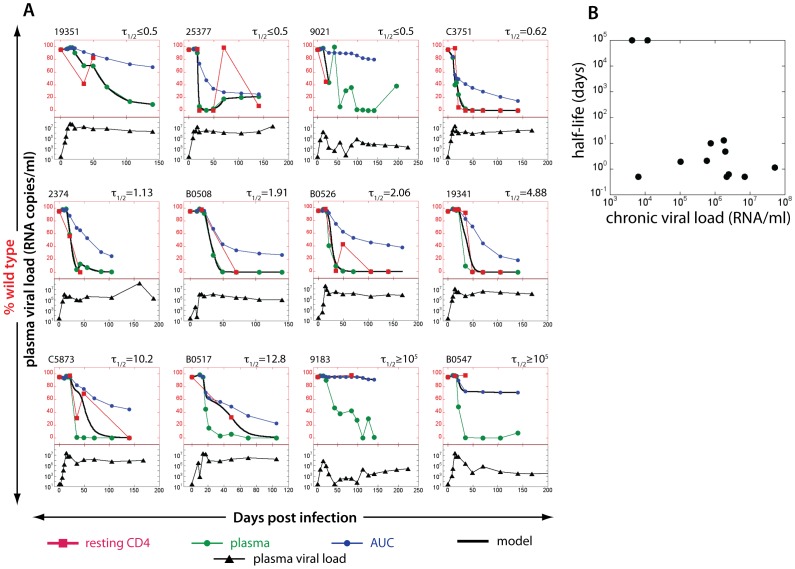
Figure 5. Estimating the half-life of SIV DNA in resting CD4+ T cells studying KVA10 escape using pyrosequencing data.
A. The proportion of WT virus in plasma (green circles), the fraction of WT virus estimated from area under the curve (AUC) of viral load (blue circles) and the experimentally observed fraction of WT virus SIV DNA in resting CD4+ T cells (red squares) for each animal in the top of each figure. The black line represents the line of best-fit SIV DNA half-life to the observed fraction of WT virus in resting CD4+ T cells for each animal. Animals are arranged in the order of increasing estimated lifespan. Total plasma viral loads (log10 scale, from 10–107) are illustrated in the bottom part of each figure (black triangles). 12 animals with sufficient data on RNA and DNA escape were available to study. B. Correlation between half-life of SIV DNA in resting CD4+ T cells with chronic plasma viral load for KVA10 epitope using pyrosequencing. Spearman correlation, r = −0.4138, p = 0.0971.

