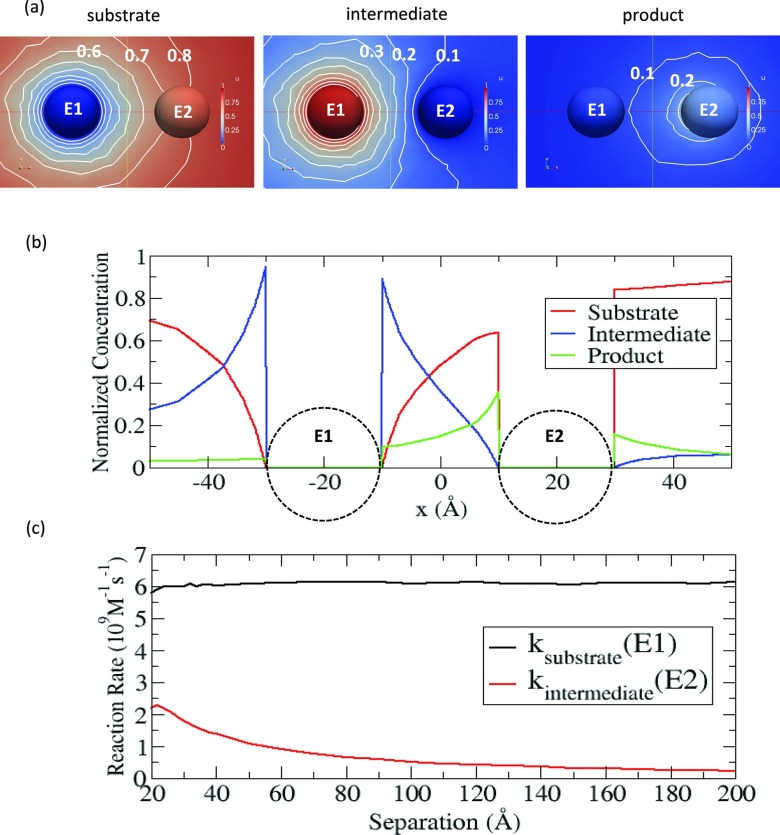
Figure 3.
(a) Normalized concentrations of substrate (left), intermediate (middle), and product (right) in the color maps (pure red = 1, pure blue = 0), when the separation distance is 40 Å. The white lines are the contours of concentrations in an interval of 0.1 (0.1, 0.2, …) (b) Normalized concentration profiles of substrate (red), intermediate (blue), and product (green) along the line connecting E1 at –20 Å and E2 at 20 Å (c) Reaction rates of the substrate at E1 and the intermediate at E2 are shown as a function of separation.

