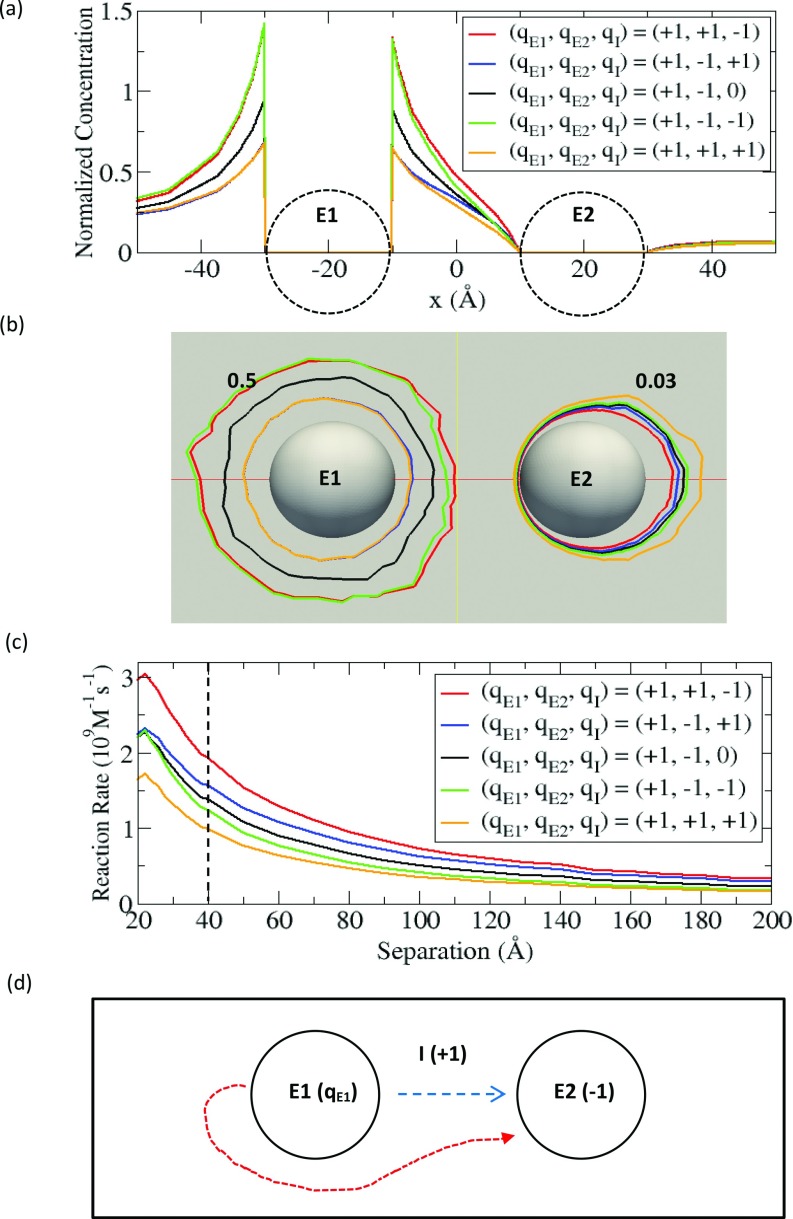
Figure 5.
(a) Normalized concentration profile of intermediate along the line connecting E1 at –20 Å and E2 at 20 Å. (b) Contours of the intermediate concentrations of 0.5 (near E1) and 0.03 (near E2). (c) Reaction rates of the intermediate at E2 with the fixed qE1 and various qE2 and qI expressed as a function of separation distance. (d) Schematic of diffusion processes from E1 and E2 in the system of (qE1, –1, +1).

