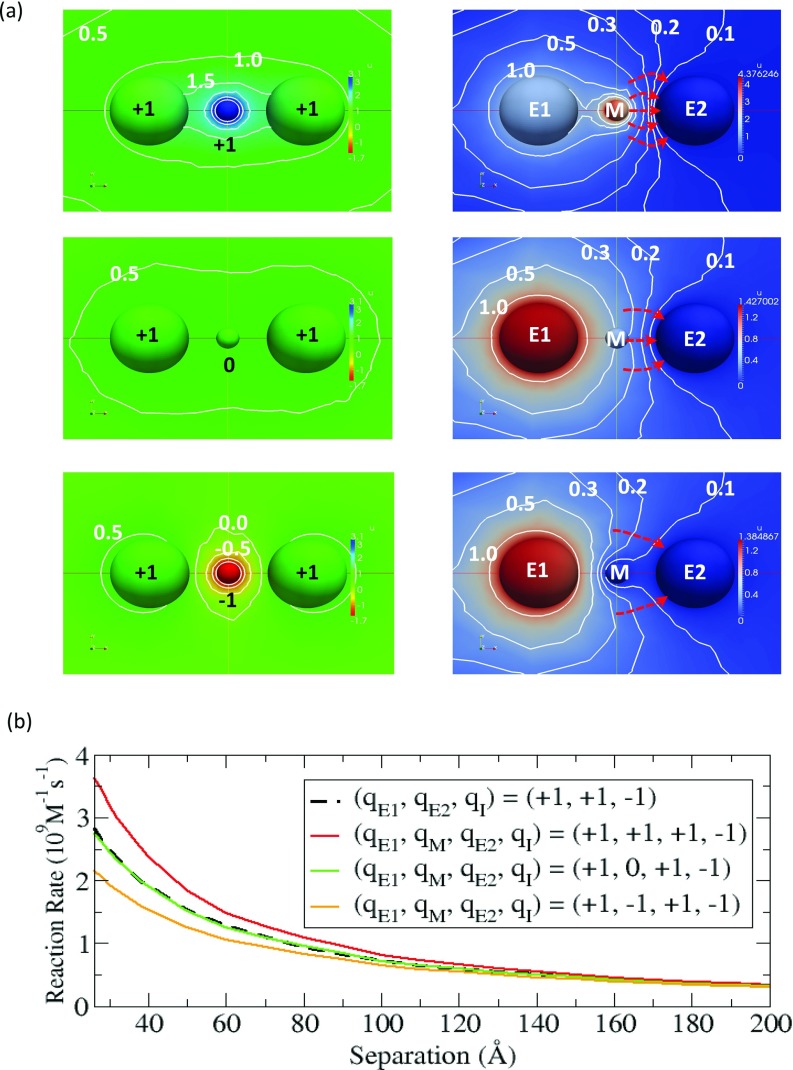
Figure 6.
(a) Electrostatic potential created by E1, E2, and the mediator (left panel) and the normalized concentration of intermediate (right panel) in the color maps. In the left panel, units are kBT/e, and pure blue and pure red represents 3.1 kBT/e and –1.7 kBT/e, respectively. In the right panel, pure red represents the maximum value in each case, and pure blue corresponds to zero. The red-dashed arrow lines indicate the flow lines perpendicular to the contours. (b) Reaction rate of the intermediate at E2 with and without a charged or uncharged mediator.

