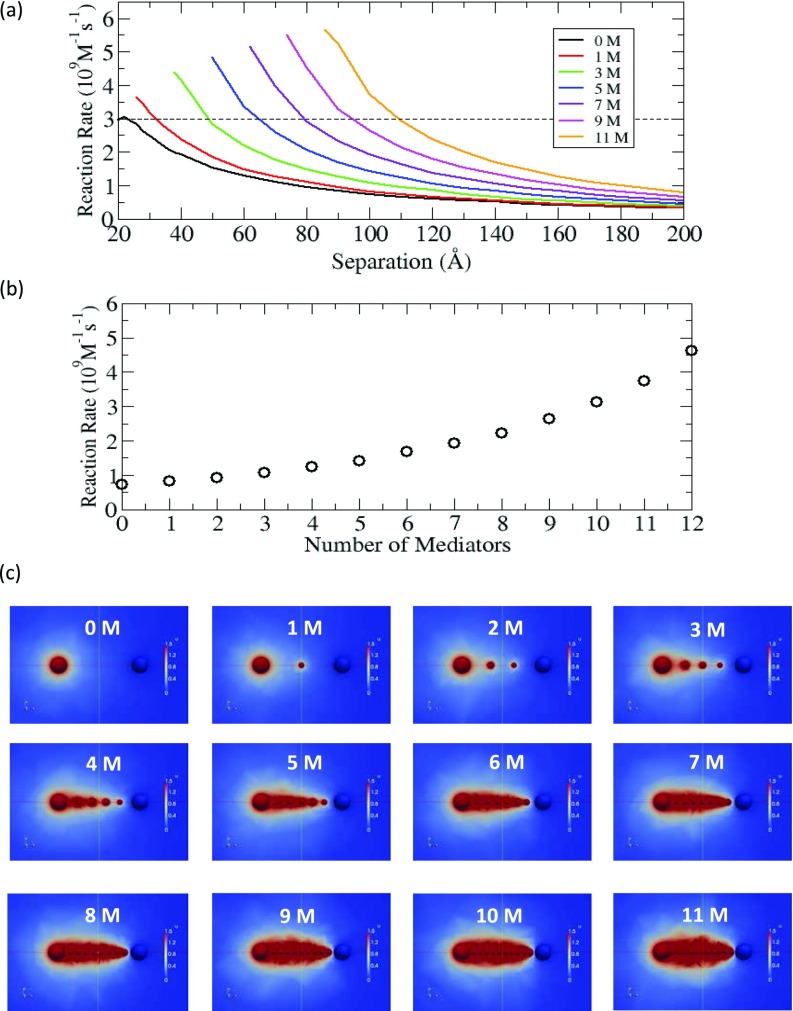
Figure 7.
(a) Reaction rate of the intermediate at E2 in the system of (+1, +1, –1) with positively charged mediators (M), as a function of the separation between E1 and E2. For each curve, the smallest distance in the plot corresponds to the distance where E1, E2, and mediators are touching each other. (b) At d = 100 Å, the reaction rate of the intermediate at E2, as a function of the number of mediators. (c) Color maps of the concentration of intermediate with different numbers of mediators, up to eleven. Pure red indicates high concentration region (≥1.5).

