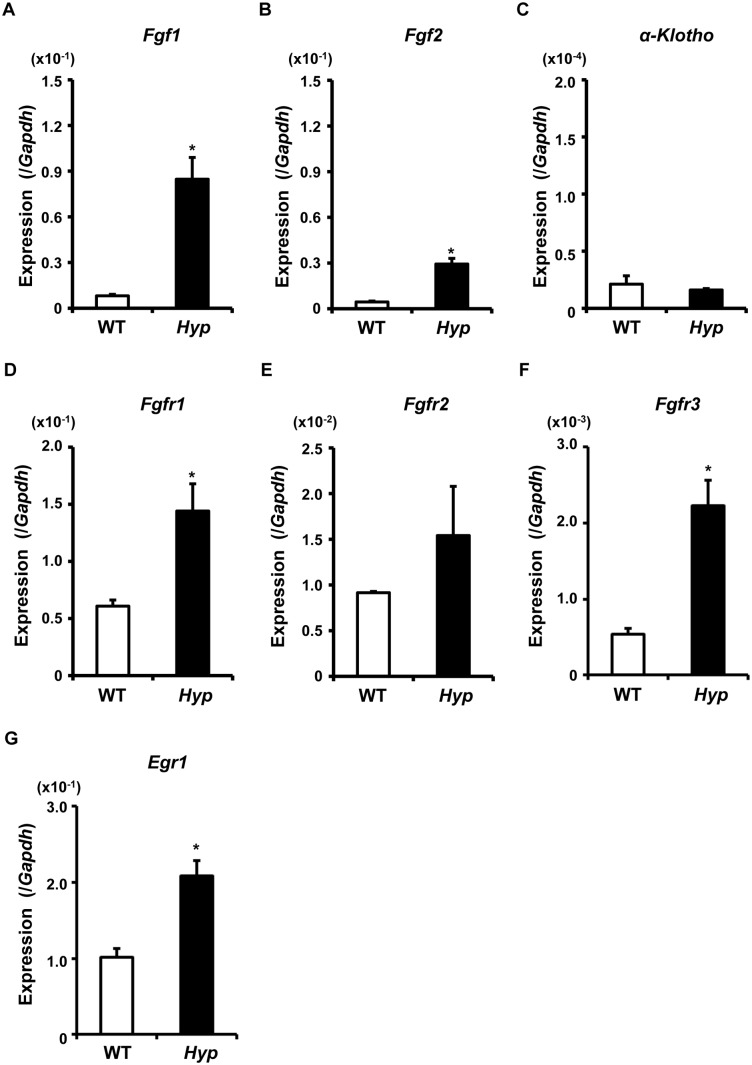
Figure 8. Increased expression of Fgf1, Fgf2, Fgfrs and Egr-1 in Hyp osteocytic cells.
RNA was extracted from the osteocytes-rich Fractions 6–9 freshly isolated from 10-week-old WT (white bars) and Hyp (black bars) bones, and real-time PCR was performed to examine the expression of the indicate genes. Data are shown as the mean ± SEM of 3 isolations. In each isolation procedure, 4 mice were used. *p<0.05 vs. WT.

