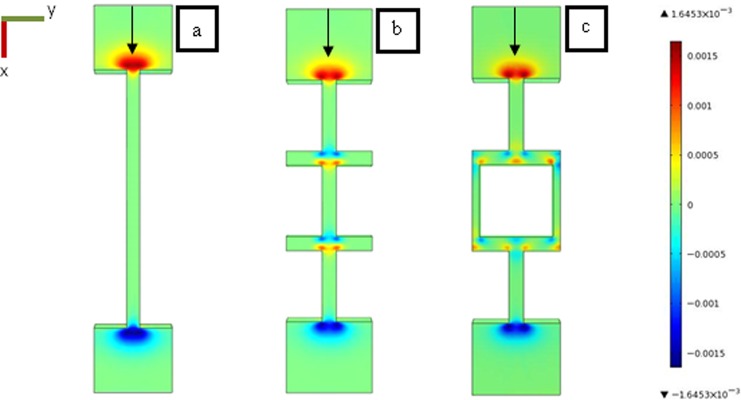
Figure 8.
Three-dimensional flow simulation for the flow geometries presented in Figure 2 [(a) straight channel; (b) connected channel; (c) staggered row]. The color map represents the z-velocity component. The green zones are relative to zones where z-velocity is not significant: the velocity vector is in xy plane. Hot colours and cold colours represent positive (towards the wall) and negative (toward the bulk) z velocity, respectively. The flow rate was 1.41 ml h−1 in the xy plane.

