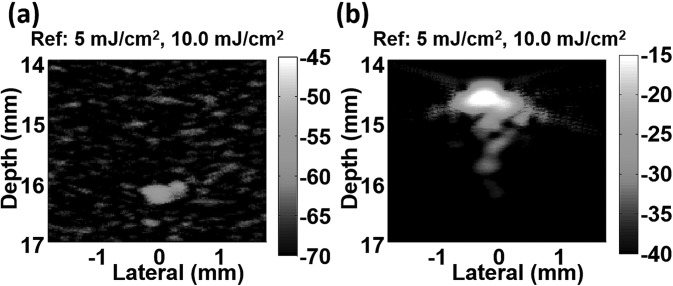
Figure 4.
Differential photoacoustic images of ink (a) and NEB-GNSs (b) at a laser fluence of 10 mJ/cm2. The reference image is at 5 mJ/cm2. Images are normalized to the maximum of the original images in Fig. 2 (0 dB) and shown with a dynamic range of 25 dB. Note that images are shown at different levels: −70 dB to −45 dB for ink and −40 dB to −15 dB for NEB-GNSs. The contrast between the two differential images is larger than 40 dB.

