
Figure 4.
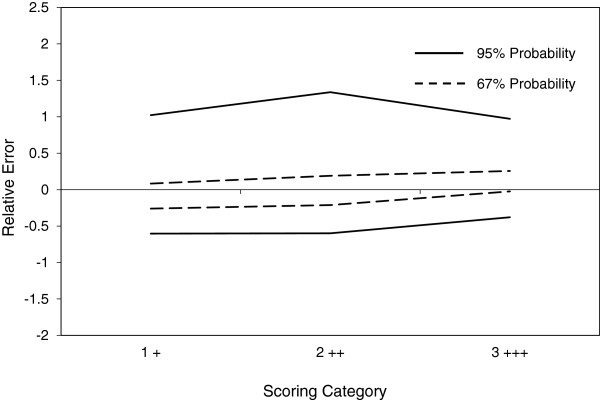
Further characterisation of inter-operator variability in AR staining intensity by IHC in CTC harvested from patient samples by ISET. After additional training utilising the standard gallery of images (see Figure 3), the same two analysts were invited to blindly score AR staining intensity in CTC harvested from patient blood samples by ISET. Again, results were analysed by a modification of ISR, β-content γ-confidence tolerance intervals (±) were calculated at β = 95% and 67% and the resulting accuracy profiles constructed. In this case, the bias observed in the first validation experiment (see Figure 2) appeared to be effectively eliminated.