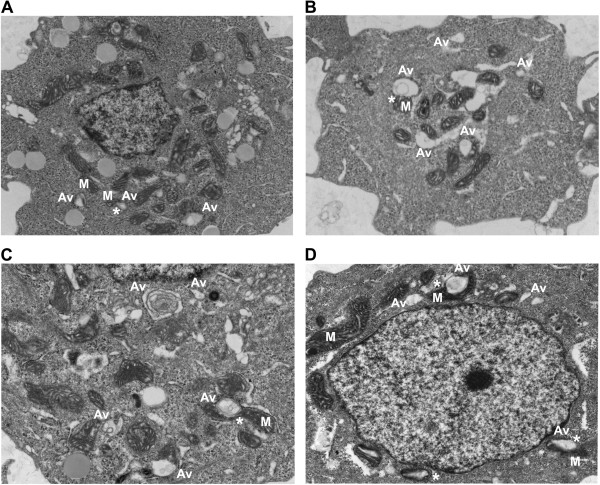
Figure 1.
Drug-induced autophagy in ER + breast cancer cells exhibit elevated autophagosome formation and indicate a direct contribution of the mitochondrial membrane in autophagosome membrane development. Electron micrograph images of A. vehicle treated LCC9 breast cancer cells. B. LCC9 cells treated with 100 nM fulvestrant for 72 hours. C. LCC9 cells transfected with estrogen receptor-α shRNA. D. LCC9 cells treated with 10 μM Imatinib for 72 hours. M indicates mitochondria; Av indicates an autophagic vesicle; * indicates mitochondria-autophagosome interaction.

