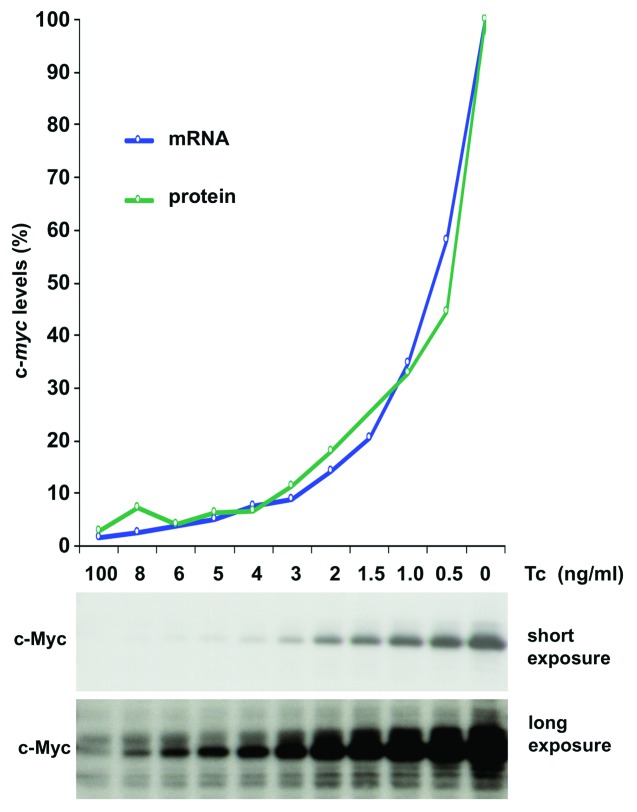
Figure 1. Titration of c-Myc protein levels. (A) Analysis of c-Myc protein levels in P493–6 cells. P493–6 cells were treated for 48 h with the indicated concentrations of Tc to obtain total RNA and protein lysates. c-Myc levels were analyzed by expression profiling (blue line) and by fluorescent protein labeling (green line). The highest expression of c-Myc was set as 100% in the diagram. The panel below the graph contains a western blot showing the c-Myc levels in P493–6 cells with varying concentrations of Tc.

An official website of the United States government
Here's how you know
Official websites use .gov
A
.gov website belongs to an official
government organization in the United States.
Secure .gov websites use HTTPS
A lock (
) or https:// means you've safely
connected to the .gov website. Share sensitive
information only on official, secure websites.
