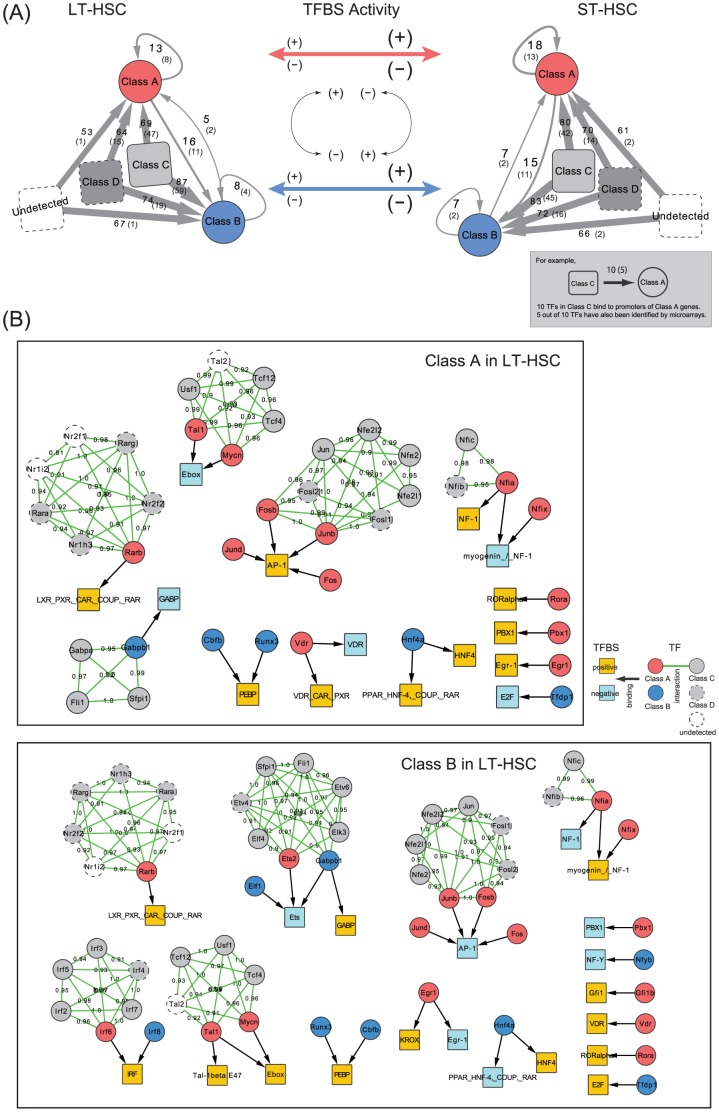
Figure 4. Inference of transcriptional regulatory networks.
(A) Systematic representation of TF–gene networks and the change of TFBS activities between LT-HSCs and ST-HSCs. Genes that produce TFs that putatively bind to important TFBSs (Figure 3A) existed in each class. Some of them were not detected in the RNA-seq assay, and were categorized as ''Undetected''. The numbers on the gray-colored arrows denote the number of TFs in the corresponding class that bind to Class A or B gene promoters, suggesting that the majority of TFs belonged to nondifferentially expressed gene classes. The numbers in parentheses indicate TFs that were detected in microarray-based studies, suggesting the extensive discovery of our assay. As shown in the middle panel, we inferred that the positive or negative activities of TFBSs are mostly unchanged between cells, but are inverted between Class A and Class B. (B) Subnetworks of (A) in LT-HSCs. The majority of TF-coding genes were not differentially expressed, whereas 24 TFs binding to 21 TFBSs were present among DEGs (Class A and Class B) and interacted strongly with nondifferentially expressed TFs (Figure S4 shows the subnetworks in ST-HSCs).

