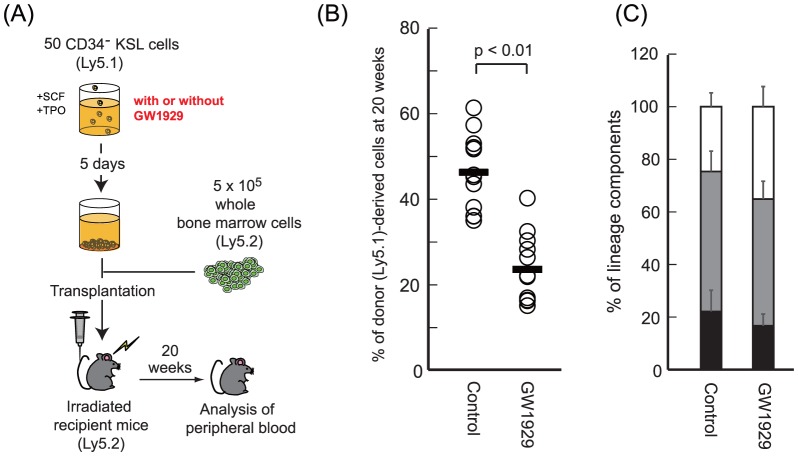
Figure 5. Long-term competitive reconstitution assay.
(A) Scheme of the competitive repopulation assay using GW1929, a high agonist of Pparg. (B) Analysis of the proportion of donor-derived  HSCs obtained from untreated (Control) and treated (GW1929) recipient mice at 20 weeks posttransplant. Each dot represents a single mouse. (C) Relative contributions of
  or
or  (T-cell lineage),
  (B-cell lineage) and Mac-1+ or Gr-1+ (myeloid lineage) cells in donor-derived Ly-5.1+ cells of recipient mice at 20 weeks posttransplant. Black, T-cell lineage; gray, B-cell lineage; white, myeloid lineage. Data are presented as the mean
  .
.

