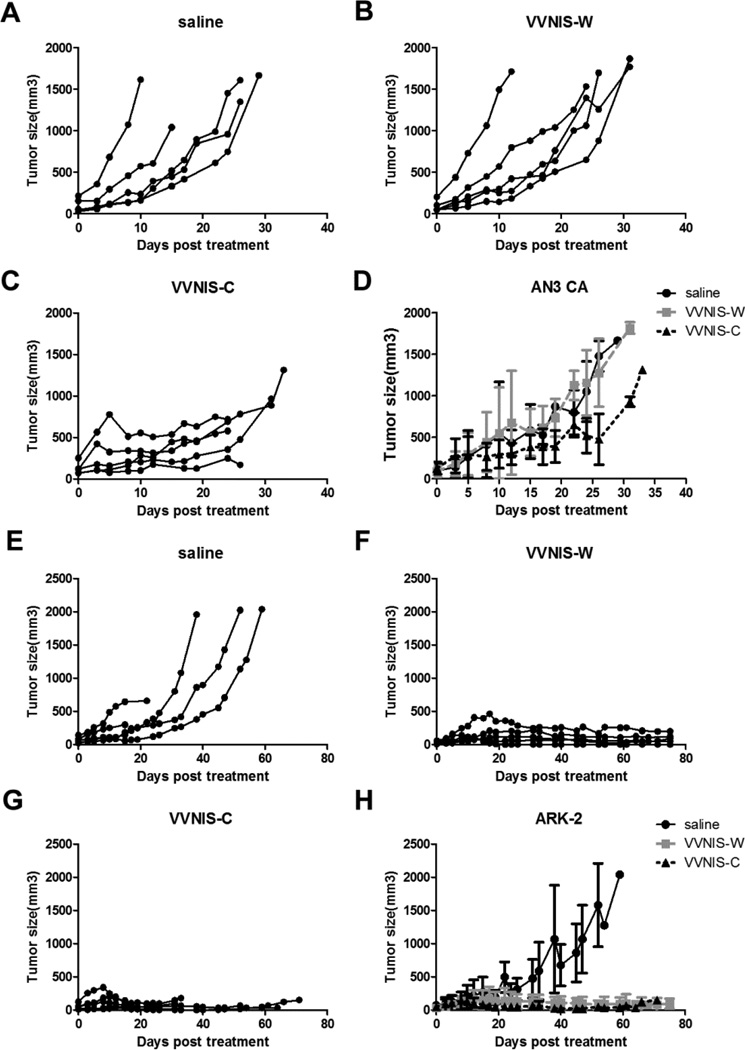
Figure 5.
Tumor response curves post intravenous administration of VVNIS-C or VVNIS-W in mice with subcutaneous (A–D) AN3 CA or (E–H) ARK-2 xenografts. Mice were randomly assigned to a single IV injection of saline, VVNIS-C or VVNIS-W (106 TCID50). A–C and E–G, Individual tumor volumes in each mouse. D and H, Average tumor volumes of each study group.

