Abstract
Induction of tumor angiogenesis is among the hallmarks of cancer and a driver of metastatic cascade initiation. Recent advances in high-resolution imaging enable highly detailed three-dimensional geometrical representation of the whole-tumor microvascular architecture. This enormous increase in complexity of image-based data necessitates the application of informatics methods for the analysis, mining and reconstruction of these spatial graph data structures. We present a novel methodology that combines ex-vivo high-resolution micro-computed tomography imaging data with a bioimage informatics algorithm to track and reconstruct the whole-tumor vasculature of a human breast cancer model. The reconstructed tumor vascular network is used as an input of a computational model that estimates blood flow in each segment of the tumor microvascular network. This formulation involves a well-established biophysical model and an optimization algorithm that ensures mass balance and detailed monitoring of all the vessels that feed and drain blood from the tumor microvascular network. Perfusion maps for the whole-tumor microvascular network are computed. Morphological and hemodynamic indices from different regions are compared to infer their role in overall tumor perfusion.
Introduction
Tumor-associated angiogenesis is an indispensable factor in the progression of solid tumors beyond a minimal size (1–2 mm3) and is considered one of the hallmarks of cancer (Hanahan and Weinberg, 2011). Tumor vasculature is characterized by chaotic morphology and excessive sprouting while the blood flow in the tumor is highly heterogeneous (Jain, 2008). Therefore, it is crucial to elucidate the dynamics of tumor blood flow to understand its role in drug delivery. Recent advances in microscopic imaging enable the accurate 3D visualization of the individual vessel morphology in tumors as well as a description of their function (Tyrrell et al., 2007). This also provides a unique opportunity for computational modeling to make detailed predictions of microvascular hemodynamics compared to bulk estimates for the whole-tumor vasculature. Until recently this type of tumor blood flow modeling was hindered because of the limited information regarding the detailed 3D morphology of tumor vasculature. High-resolution techniques such as µCT (micro-computed tomography) can provide such 3D data with high fidelity, and have paved the way for the use of computational blood flow models in translational and personalized medicine. Specifically, high-resolution spatial imaging spanning the whole-tumor vascular network will enable realistic simulations of blood flow in every segment of the tumor vascular network (Kim et al., 2012b).
Mechanistic, image-based hemodynamic modeling can aid in a detailed understanding of the distribution of blood in vascular networks across various spatial scales (Guibert et al., 2013; Guibert et al., 2010). Benedict et al. also used confocal microscopy to obtain microvascular network data from immunostained skeletal muscle and performed hemodynamic simulations based on this data (Benedict et al., 2011). Synchrotron radiation based micro-computed tomography (SRµCT)-derived vascular data were used by Reichold et al. to simulate cerebral blood flow (Reichold et al., 2009). Micro-computed tomography data were used by Lee and Smith to implement a novel approach linking blood flow and hematocrit in a coronary microvascular network model (Lee and Smith, 2008). Yang et al. employed µCT-derived 3D vascular data to simulate the hemodynamics of the rat placenta and lung vasculature (Yang et al., 2010). Recently, we employed µCT-derived 3D vascular data acquired from a human breast cancer xenograft model to demonstrate the feasibility of simulating tumor hemodynamics (Kim et al., 2012b).
One of the major hurdles to incorporating whole-tumor imaging data in multiscale biophysical models is the ability to quantitatively analyze 3D vascular datasets spanning three orders of magnitude (µm to cm) in an automated manner. Typically, high-resolution 3D image stacks are several gigabytes, and require specialized software for image segmentation (Peng et al., 2010). The field of ‘bioimage informatics’ is relatively new and involves the transformation of traditional image processing results to biologically meaningful knowledge using informatics approaches (Myers, 2012). Bioimage informatics approaches have been employed recently to trace the patterns of neurite morphology in fruit flies and C. elegans (Peng, 2008; Peng et al., 2010). Similar algorithms have also been used to complement analysis of single-cell level imaging data to track surface receptor trajectories and actin filament speckle flows (Jaqaman et al., 2011; Ji et al., 2008).
In the current study, we are dealing with a large microcirculatory tumor vascular network comprising numerous boundaries (i.e. blind ends) and an incomplete understanding of the flow directionality compared to other well-characterized physiological systems (Pries et al., 2009; Pries et al., 2010). Moreover, incomplete microvascular filling and limitations in spatial resolution resulted in discontinuities in the topology of the tumor vascular network. Therefore, we developed a 3D tracking and reconstruction algorithm to traverse the whole-tumor 3D vascular network (to systematically examine nodes and segments), identify discontinuities in the image dataset, and reconstruct the topology based on local cues in the imaging data. Furthermore, we formulated an optimization algorithm to deal with the incomplete boundary data and flow directionality in tumor vasculature. Our method iteratively optimizes the boundary pressures employing a detailed nonlinear optimization algorithm. Specifically, it involves the analysis of the effect of the number of boundaries on the perfusion estimates for the tumor microvasculature and correlates it to similar experimental findings. Our computational model takes into account the nonlinear rheological properties of blood (i.e. Fahraeus, Fahraeus-Lindqvist and plasma skimming effects) that are known to be significant in the microcirculation (Popel and Johnson, 2005).
Overall, this study describes a novel bioimage informatics methodology for the reconstruction of high-resolution, wide-area, 3D microvessel geometry from µCT data. This approach enables the generation of detailed perfusion maps for the entire tumor vasculature, as well as computation of various morphological and hemodynamic indices to gain insights into perfusion heterogeneity in solid tumors (Pries et al., 2009; Secomb et al., 2012).
Materials and Methods
Ethics Statement
All animals were handled in accordance with good animal practice as defined by the relevant national and/or local animal welfare bodies, and all animal work was conducted under a protocol approved by the Institutional Animal Care and Use Committee (IACUC) of Johns Hopkins University. The Johns Hopkins University animal facility is accredited by the American Association for the Accreditation of Laboratory Animal Care and meets National Institute of Health standards as set forth in the “Guide for the Care and Use of Laboratory Animals” (DHHS Publication No. (NIH) 85–23, Revised 1985).
Tumor Model and Imaging Protocol
Tumor xenografts were initiated by orthotopic inoculation of 106 triple-negative human breast cancer (MDA-MB-231) cells into the mammary fat pad of female NCr-nu/nu mice. At 5 weeks post-inoculation the animals were deeply anesthetized with isoflurane and sacrificed by perfusion fixation. First, 20 ml of PBS was injected into the left ventricle via a 25G butterfly needle (BD Vacutainer®; Becton, Dickinson and Company, Franklin Lakes, NJ), followed by 20 ml of formalin. Finally, perfusion with 20 ml of the radio-opaque vascular filling agent Microfil (FlowTech Inc., MA) as we described in (Kim et al., 2011). The jugular veins were cut to allow drainage of perfusates, which were injected manually at an approximate rate of 4 ml/min. The tumor volume was 280 mm3. All the animal experiments were conducted according to an animal protocol approved by the Institutional Care and Use Committee at Johns Hopkins Medical Institution. Ex-vivo imaging of the complete tumor vasculature was performed using µCT. Samples were sent to be imaged at Numira Biosciences (Salt Lake City, UT) with a volumetric µCT scanner (µCT40, ScanCo Medical, Zurich, CH) at 8 µm isotropic voxel resolution, 55 kVp, 300 ms exposure time, 2000 views and 5 frames per view. The DICOM µCT data were converted to a raw data format for analysis in the 3D visualization software Amira (Mercury TGS, Merignac, France; San Diego, USA; Zuse Institute, Berlin, Germany). Tumor vasculature was represented as segments as described in (Kim et al., 2012a). Briefly, vessels were extracted using a Hessian-based, multi-scale ‘tubeness’ filter in ImageJ (Rasband, W.S., ImageJ, U. S. National Institutes of Health, Bethesda, Maryland, USA, http://imagej.nih.gov/ij/, 1997–2012). This filter convolves the image with a spherical Gaussian kernel in each voxel, computes the Hessian matrix and the corresponding Hessian eigenvalues. Next, a binary 3D vascular structure was obtained by applying an iterative threshold algorithm on the result of the filter. Skeletonization of the binarized vasculature and extraction of vessel centerlines was conducted using Amira software, resulting in a highly detailed tumor vascular network consisting of a set of cylinders around the centerline points. The radius of each cylinder was determined in Amira using the corresponding Euclidean distance map at these points.
The resulting data structures from this image processing were stored in an ASCII file that encodes the topology of the tumor microcirculatory network. The microvascular network is treated as a spatial graph, i.e. an object consisting of a set of centerline points (or nodes) representing image voxels; their Cartesian coordinates; and edges that connect these nodes, depicting the association of neighboring voxels (Dale and Fortin, 2010; Hirsch et al., 2012). In such a vascular spatial graph, nodes are divided into three categories: branching, internal and boundary nodes. Branching nodes represent coordinates in which segments branch to other segments (e.g. bifurcations) and have 3 or more nodes they are connected with (i.e. minimum 3 degrees of freedom). Internal nodes are located between branching nodes, in a graph sense, and are connected with 2 of their neighboring nodes (2 degrees of freedom). These annotations are necessary to represent the length, average radius or other features such as tortuosity of individual segments, which are defined as the series of edges between 2 branching nodes. These characteristics vary from segment to segment and allow the 3D visualization software to represent the intricate characteristics of the microcirculatory geometry. Boundary nodes represent the leaf vertices of the graph which are connected only to one node (1 degree of freedom). They represent discontinuities in the microcirculation (i.e. non-connected segments) or blind ends, which is common in tumors due to sprouting (Vaupel, 2004).
3D Tracking and Reconstruction Algorithm
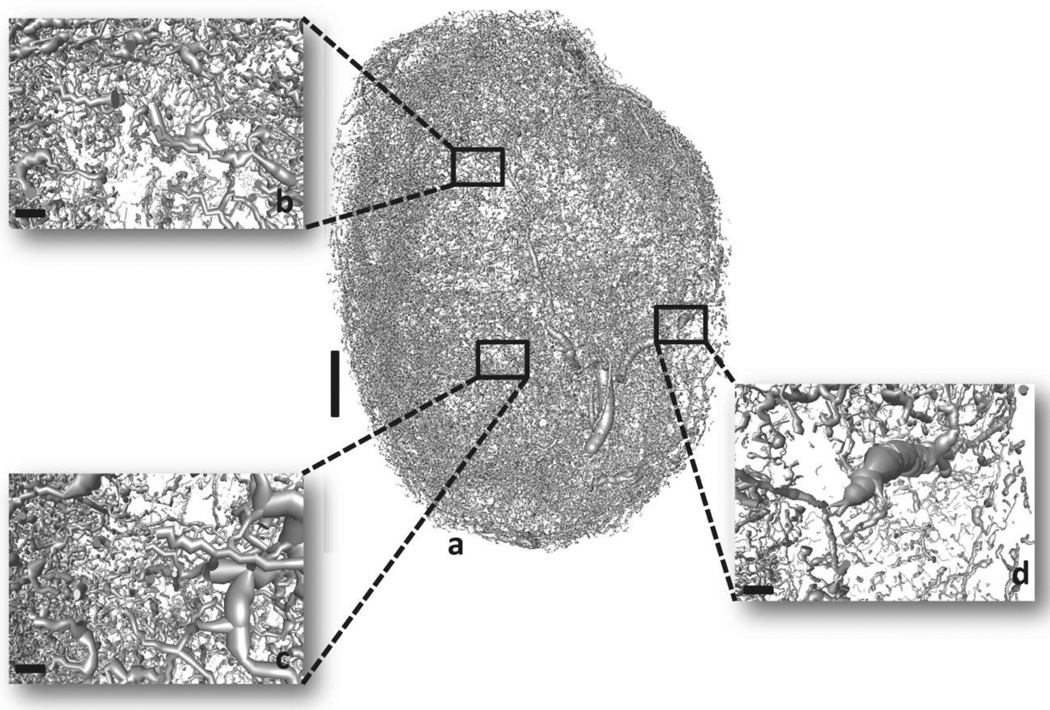
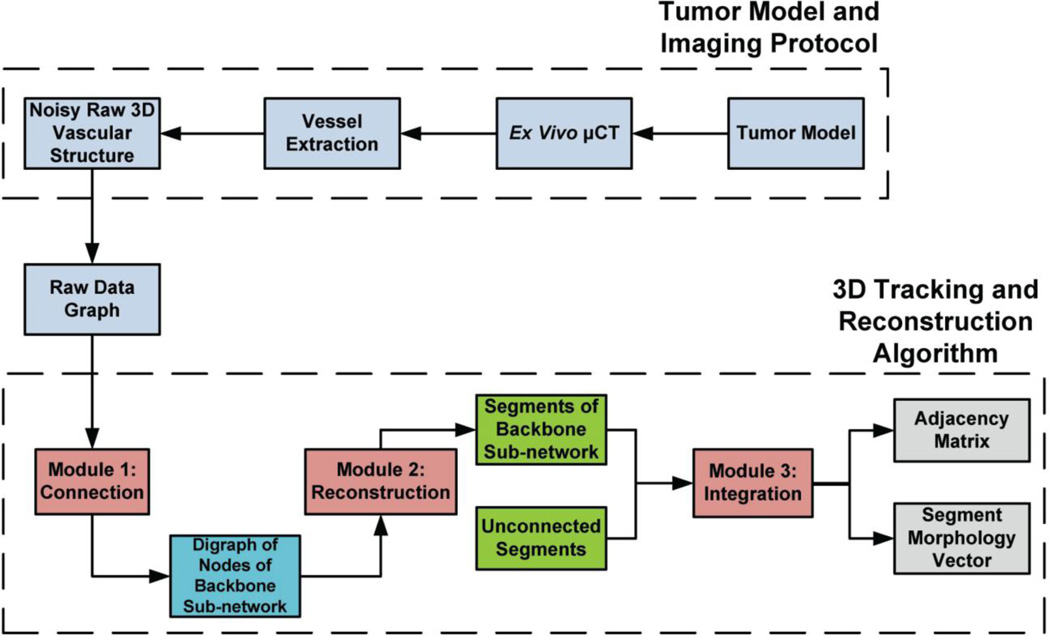
Despite the high spatial resolution and wide-area coverage, the resulting raw vascular structure exhibited discontinuities that hindered the application of any mass balance or fluid mechanics laws (Fig. 1). This was confirmed by treating the vasculature as a spatial graph and performing graph-based analysis (see Supplementary Information). Therefore it became imperative to create a method that could handle an enormous amount of data points and reconstruct missing parts of the microvasculature. We developed a computer-aided image data-driven approach to reconstruct and characterize the whole-tumor vasculature (adjacency matrix and segment morphology vector) before proceeding to blood flow simulations (Fig. 2).
Fig. 1. 3D micro-CT derived whole-tumor microvasculature from a human triple-negative breast cancer xenograft (MDA-MB-231 cells).
Vessel segmentation results in morphological discrepancies and discontinuities in the vasculature. (a) Raw tumor vascular network. (b), (c) and (d) insets illustrate magnified regions of the raw vascular network. Scale bars: 1 mm (a), 100 µm (b), (c) and (d).
Fig. 2. Outline of the combined computational-experimental procedure for tumor vasculature characterization.
Human breast cancer xenografts are excised and high resolution µCT imaging is performed. Image vessel segmentation yields noisy discontinuous raw vascular structures that require further processing. The 3D tracking and reconstruction algorithm consists of 3 modules. Module 1 implementation involves connection of discontinuous vessels based on geometrical similarities (patterns). The output of Module 1 is a graph involving an ensemble of nodes that are fully connected. Module 2 implementation involves reconstruction of individual segments from these nodes and annotation of them (internal, branching, boundary). Module 3 implementation involves integration of this connected sub-network to the remaining structure through identification of common nodes. The output of the algorithm is the adjacency matrix and the segment morphology vector that uniquely characterize the network connectivity and morphology.
The 3D tracking and reconstruction module (Suppl. Fig. 1) we have developed is presented in detail in Supplementary Information. Briefly, it is an algorithm consisting of three modules:
A breadth-first search (BFS) traversal algorithm mapped on a structured grid to construct a directed graph of nodes (or digraph) (Suppl. Fig. 2).
A depth-first search (DFS) traversal algorithm exploiting the output of Module 1 to topologically sort individual nodes into segments (Suppl. Fig. 3).
- A sorting algorithm (Suppl. Fig. 4) to perform the following tasks:
- Sort the outputs of Module 2 and encode their topology in a heap.
- Develop a priority queue to visit the segments not explored by the BFS algorithm and find common branching nodes and integrate them.
- Index the segments and construct the final topology.
The algorithm was implemented in Java (Eclipse Foundation, Inc., Ontario, Canada) and MATLAB (The MathWorks, Inc., Natick, MA) and executed in parallel CPUs mode.
Model for Pressure and Flow Distribution
The discretization of the tumor vascular network into nodes and segments allows us to apply a generalized empirical 1D method to the network using a Poiseuille-type equation with appropriate boundary conditions (Ji et al., 2006; Popel, 1980; Popel and Johnson, 2005). We introduce blood flow rate (Qij) and pressure drop (Pi - Pj) in individual segments governed by the equations:
| (1) |
| (2) |
| (3) |
where Gij is the hydraulic conductance of a segment, µij is the apparent viscosity, and flow rate Qij is related to pressure drop (Pi - Pj) by a Poiseuille-type equation. Viscosity of blood µij in individual segments is evaluated by rheological formulas presented in the Supplementary Information, which were derived by Pries and Secomb using a combination of experimental data and mathematical modeling (Pries et al., 2001a; Pries et al., 2001b; Pries et al., 1990; Pries et al., 1994).
Application of conservation of mass led to a sparse system of equations:
| (4) |
If suitable pressure boundary conditions are imposed at all boundary nodes Eq. 4 can be transformed to:
| (5) |
where Gint is the sparse non-symmetric matrix containing the hydraulic conductance of segments defined by branching nodes, and Pint is the pressure vectors of the corresponding points; Gb is the vector of conductance of segments defined by the branching nodes that are connected to boundary nodes, and Pb is the pressure vector of boundary nodes. This system is solved for pressure (Pint) at all branching nodes based on the assumption that viscosity µij and hematocrit (HDij) are known in all segments; we subsequently solve the full nonlinear problem with unknown µij and HDij. We define and solve the problem in MATLAB using the generalized minimum residual method (GMRES), which is a Krylov subspace iterative method for sparse linear systems (Saad and Schultz, 1986).
Optimization Algorithm for Boundary Conditions of Tumor Vascular Network
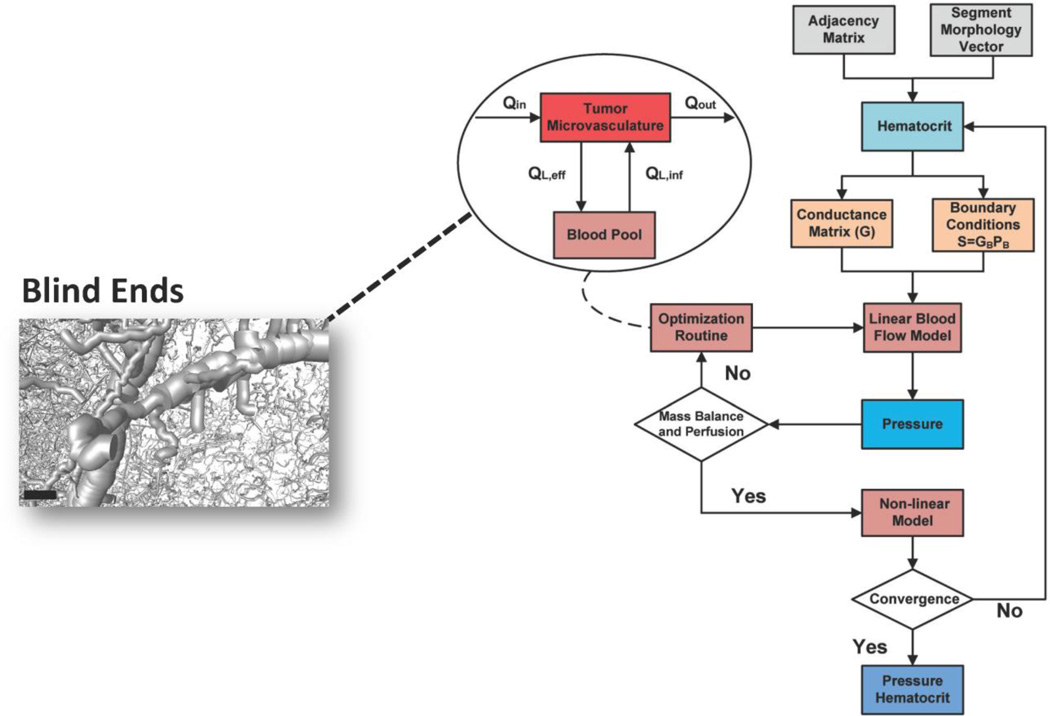
Due to the atypical structure of the tumor microvascular network, the standard terminology used to distinguish the microvessels (arterioles, venules and capillaries) cannot be used in the same manner as in a normal physiological tissue. However, it is imperative to define boundary conditions for the thousands of boundary nodes in the tumor vascular network. Specific boundary nodes (of the order of tens) are pre-assigned as inlets and outlets to the tumor vascular system. These boundary nodes are chosen in a similar manner as the nodes chosen for the initiation of the BFS module. These boundary nodes belong to large diameter segments (30–80 µm, at least 2-fold greater than the mean diameter) in the periphery of the tumor and are assumed to be connected to peritumoral vessels (Gaustad et al., 2009). These boundary nodes are assigned a range of boundary conditions based on reported measurements for pressure of inlets, outlets and pressure drop across microvascular networks (Less et al., 1997). However, the microvascular topology, even after the application of the BFS algorithm, contains a vast number of additional boundary segments (on the order of thousands) that cannot be directly connected to any other segment (i.e. blind ends) (Fig. 3). These segments can either be artifacts of the image reconstruction, immature angiogenic sprouts, or connections to a capillary-like bed that includes diameters below the spatial resolution of µCT. Another possibility is that due to the higher viscosity of the Microfil (∼20cP) compared to blood, there might be structures that were not perfused and therefore not visible to µCT. We treat this underdetermined linear system by applying an optimization technique (Fry et al., 2012), exploiting available literature information on blood perfusion studies of breast cancer, as well as the distinct nature of the tumor vascular network. Our methodological approach is presented in the Supplementary Information and is not biased regarding the choice of flow directionality.
Fig. 3. Schematic of the iterative process for pressure and hematocrit estimation in the microvascular network.
The outputs of bioimage informatics algorithm and an initial assumption for hematocrit and boundary conditions are the inputs to the hemodynamic model. The linear blood flow model provides initial estimates of internal and boundary pressures. The regional perfusion is checked if it is in the experimentally reported range. The mass balance is checked with respect to vessel segments that perfuse or drain blood from the vasculature. If any of these conditions is not satisfied the nonlinear constrained optimization routine adjusts the boundary pressure vector, and the blood flow model is run again with updated boundary conditions. The optimization is based on a compartmental model shown in the inset flowchart, simulating the exchange of blood between the tumor microvasculature and the blood pool compartment. This influx/efflux takes place through boundary segments as the ones presented in the inset image. The nonlinear model provides estimates for hematocrit values across all segments of the vasculature. The process is iterated until convergence. Scale bar: 100 µm.
Finally, we conducted sensitivity testing to explore the importance of the blind end density to overall tumor perfusion. We performed independent simulations by varying the number of blind ends via random sampling from a uniform distribution. The density of these blind ends was calculated as number per unit length.
Nonlinear Model for Hematocrit Estimation
The above analysis was conducted under the assumption of constant hematocrit. However, due to the phase separation effect of blood at vascular bifurcations where red blood cells and plasma are unevenly distributed, the hematocrit distribution had to be calculated (Pries and Secomb, 2003). This phenomenon induces heterogeneity of the hematocrit among the segments of the vasculature (Dawant et al., 1986; Levin et al., 1986). In vivo experiments performed in the rat mesentery allowed the formulation of empirical equations to be developed to describe the phase separation effect in divergent bifurcations. The equations are presented in the Supplementary Information and lead to estimation of discharge hematocrit values. This process is then iterated until convergence (Ganesan et al., 2010; Lorthois et al., 2011). A schematic summarizing the methodology for the blood flow and hematocrit calculations is presented in Fig. 3.
Morphological and Hemodynamic Analysis
Morphological and hemodynamic parameters are calculated for the entire tumor vasculature and various regions of interest (ROI) of the tumor (Safaeian et al., 2010). These include:
| (6) |
| (7) |
| (8a) |
| (8b) |
| (9) |
Eq. 9 is based on Krogh's model for diffusion from capillaries.
The standard definition of tortuosity in 2-D is based on the ratio of arc length to the Euclidean distance between two end nodes:
| (10) |
The box-counting algorithm in MATLAB was used to calculate the fractal dimension using the processed binary image as an input (Gould and Reece, 2012; Moisy, 2006). The binary image contains all vessel information in the form of a 3D matrix containing zeros and ones.
The flow rate vector (Qij) of the tumor vascular network estimated after the iterative convergence of the mathematical model allowed us to estimate the following blood transport-related measures (indices):
| (11) |
| (12) |
| (13) |
| (14) |
| (15) |
where mtissue is the tissue mass. We also calculated fractal characteristics and statistical distributions of segment diameter, length, velocity and shear stress.
Results
Reconstruction of Tumor Microvessel Network
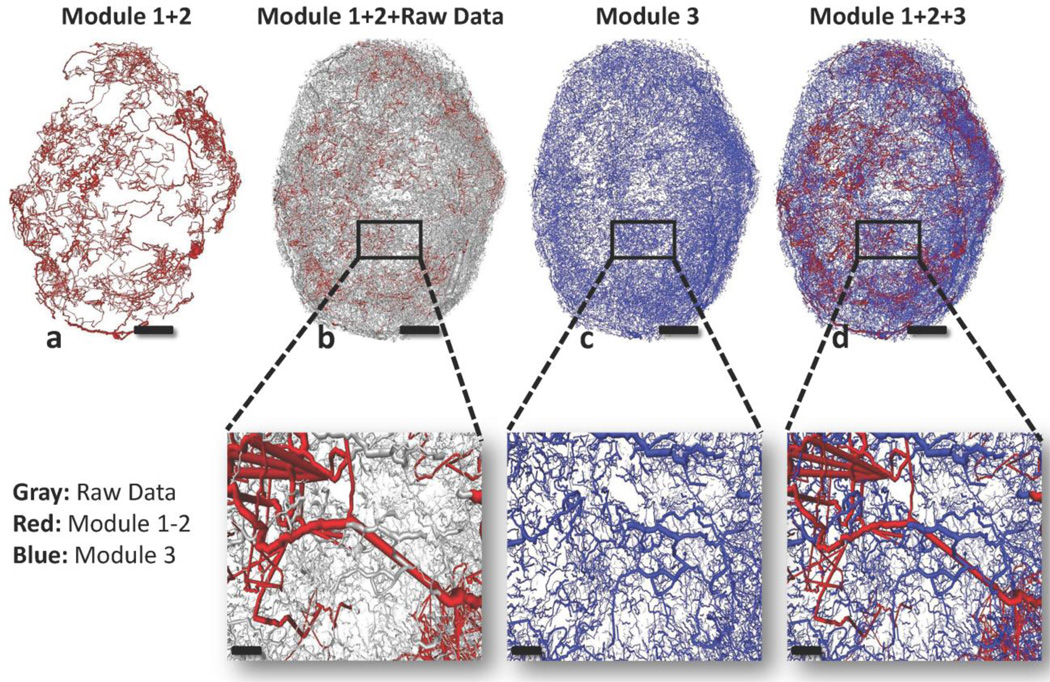
In Table 1 the performance of each Module is presented as a number of segments and nodes that was able to capture. Module 3 which exploits the fully connected sub-network of Modules 1 and 2, scores more than 90% with respect to the reconstruction of the initial raw data. Fig. 4 presents the sequence of the output images as the bioimage informatics pipeline produces them. Fig 4a presents the connected backbone sub-network of the whole vasculature produced by Modules 1 and 2. Fig. 4b presents the backbone sub-network overlaid by the raw data and confirms that our approach minimally alters the vascular structure. On the other hand, it allows the establishment of a framework upon which all the other unconnected segments (Fig. 4c) can be positioned. This positioning by Module 3 does not alter the salient morphological features of these entities (Fig. 4b vs. 4d). Such an extensive tracking and coverage of the patterns of the segmented image permits comparison of various regions. Thus, six ROI (20 mm3 in volume) were randomly selected; three near the tumor core and three towards the rim to compare their perfusion characteristics and potentially discover links between morphological and hemodynamic metrics.
Table 1.
Segments and nodes identified and reconstructed by the different modules of the 3D tracking algorithm.
| Tumor Vascular Network | Nodes | Segments |
|---|---|---|
| Raw Vascular Network | 562,243 | 53,778 |
| Module 1+2 | 57,447 | 4,430 |
| Module 3 | 453,166 | 41,095 |
| Module 1+2+3 | 510,613 | 45,525 |
Fig. 4. Sequence of output images illustrating the microvascular network reconstructed by the 3D tracking algorithm.
(a) Red segments represent the connected backbone sub-network tracked by Modules 1 and 2. (b) Grey segments represent the raw data which were not captured by Modules 1 and 2. (c) Blue segments represent the unconnected segments tracked by Module 3. (d) Red and blue segments are integrated and provide the final structure of the vasculature. Panels scale bar: 1 mm. Insets scale bar: 200 µm.
Experimental Validation
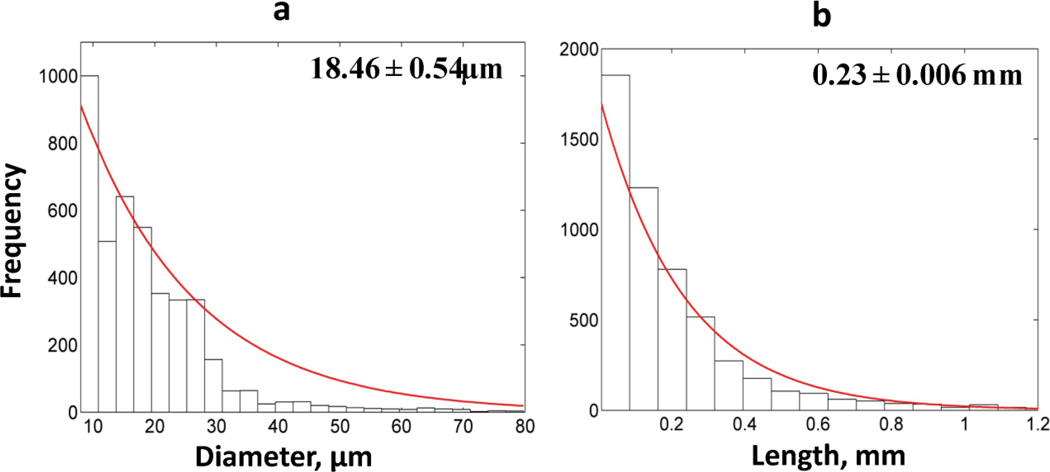
Fig. 5 presents the frequency distributions of diameters and lengths of vessel segments of the entire tumor vascular network. The exponential distribution best fits the data, which was confirmed by χ2 goodness of fit (p-value<0.01) and one-sample Kolmogorov-Smirnov (K-S) test (p-value<0.01). The confidence intervals of mean values were estimated through nonlinear regression analysis. Table 2 summarizes the morphological parameters for the entire tumor vascular network along with the comparison to values reported in the literature. The mean value and range of tumor vascular density, vascular diameter, length and ratio S/V are in agreement with those reported for various types of xenograft models (mostly breast) (Nagy et al., 2012; Sitohy et al., 2012; Yuan et al., 1994). Similar findings are presented for other morphological parameters such as tortuosity, mean extravascular length and fractal dimension (Konerding et al., 1999; Vakoc et al., 2009).
Fig. 5. Frequency distributions of tumor vessel segment radii and lengths.
(a) Frequency distribution of segment diameters is exponential for the tumor vascular network. (b) Frequency distribution of segment lengths is exponential for the tumor vascular network. The panels present the mean values and the confidence intervals.
Table 2.
Geometrical and fractal properties of tumor vascular network and comparison with characteristic values reported in the literature.
| Properties | Tumor Vascular Network |
Literature Values (Refs) |
|---|---|---|
| Volume Density - VD (%) | 0.67 | 0.15–1.25 (Nagy et al., 2012; Sitohy et al., 2012) |
| Length Density - LD (mm/mm 3) | 20.87 | 10–72 (Kim et al., 2012a) |
|
Vascular surface area to Vascular volume ratio - S/V (mm2/mm3) |
165 | 122–376 (Chugh et al., 2009) |
| Mean Diameter (µm) | 18.46 | 5–225 (Hashizume et al., 2000; Yuan et al., 1994) |
| Mean Length (mm) | 0.23 | 0.06–0.3 (Pathak et al., 2011) |
|
Maximum extravascular diffusion distance (µm) |
123 | 30–250 (Konerding et al., 1999) |
| Fractal Dimension | 2 | 1.94–2.04 (Baish et al., 2011) |
| Tortuosity | 1.41 | 1.4-2 (Vakoc et al., 2009) |
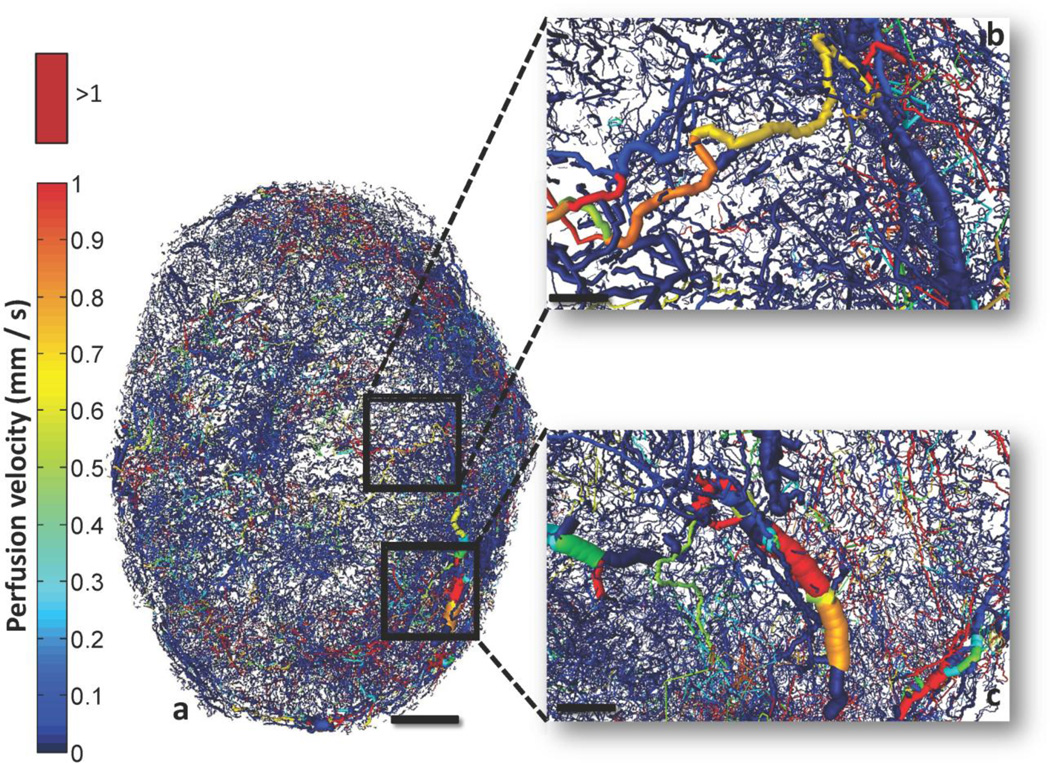
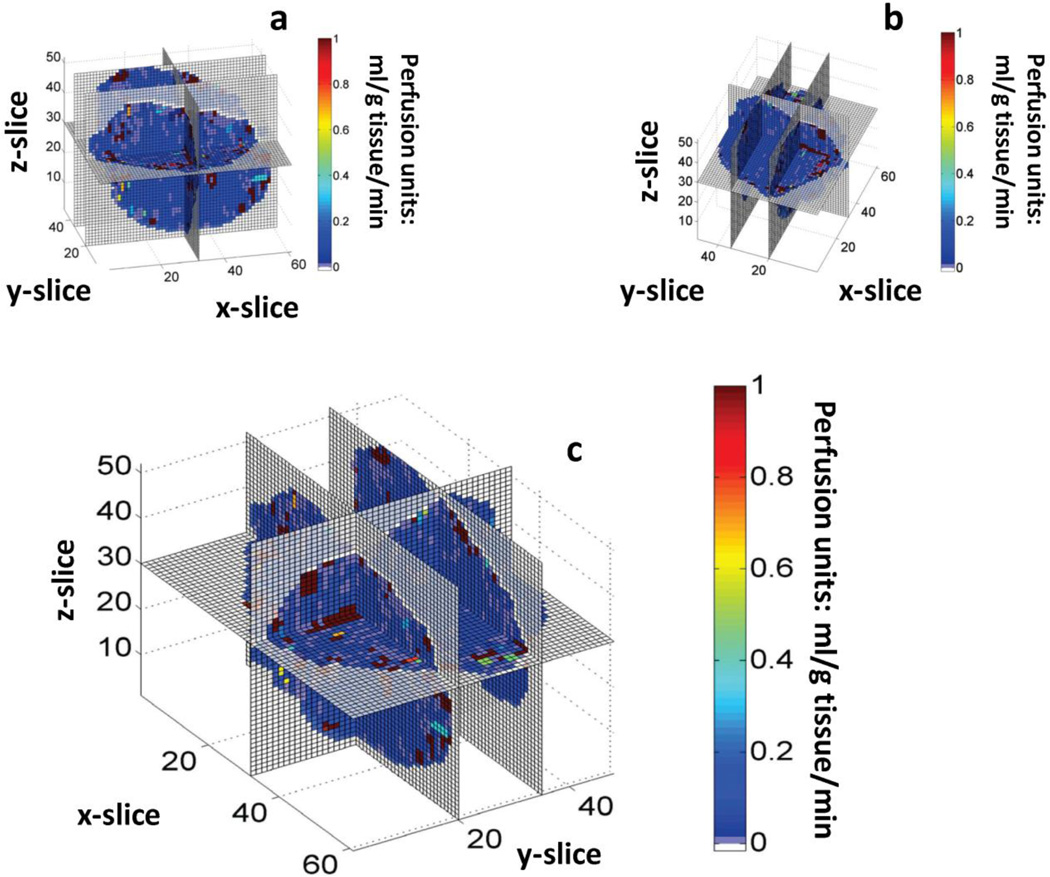
Fig. 6 depicts the perfusion velocity for the whole-tumor vasculature as a composite image. We observed the presence of vessel segments exhibiting high and intermediate flow velocities, but most had velocities below 1 mm/s (Kamoun et al., 2010). The hemodynamic characteristics of the tumor vasculature were examined for four different scenarios of increased number of inlets/outlets to the system (Table 3). The major results from this comparison were the following: perfusion was influenced by the number of blind ends contributing to influx/efflux of blood, but this variation remained within the experimentally reported range (Hirasawa et al., 2007; Kallinowski et al., 1989; Sabir et al., 2008). This perfusion elevation yielded a seemingly contradictory result: a decrease in mean flow velocity and shear stress, and an increase in VSTT and hypoperfusion of individual segments. Moreover, mean flow velocity and the range of velocities computed agree with values reported by high-resolution measurements using multiphoton microscopy in human mammary adenocarcinoma and glioma xenograft models (Kamoun et al., 2010). These values ranged up to 10 mm/s, while most of the data were below 1mm/s. This is consistent with our predictions in Fig. 9. Moreover, velocity measurements in mesenteric networks range up to 10–14 mm/s, which were also consistent with theoretical predictions (Pries et al., 2003; Pries et al., 1995). Fig. 7 presents a spatially coarser perfusion map, in which the vasculature was discretized and an average perfusion value estimated for each voxel (100×100×100 µm3). This depiction shows pockets of voxels with high or low perfusion at all distances from the core of the tumor. On average it appeared that the perfusion increased towards the rim, but there were also well perfused regions closer to the tumor center (Bowden and Barrett, 2011; Vaupel, 2004).
Fig. 6. Whole-tumor perfusion map.
(a) Detailed perfusion map of the whole-tumor vascular network color-coded by perfusion velocity (mm/s). (b) and (c) insets illustrate a magnified 3D perspective of different regions of tumor vasculature color-coded by perfusion velocity. Perfusion velocities >1 mm/s are color-coded bright red. Scale bars: 1 mm (a), 200 µm (b) and (c).
Table 3.
Comparison of hemodynamic parameters for four different simulation scenarios.
| Properties | No blind end contribution |
33% blind end contribution |
67% blind end contribution |
100% blind end contribution |
Literature Values (Refs) |
|---|---|---|---|---|---|
| Perfusion (ml/g/min) | 0.14 | 0.08 | 0.17 | 0.36 | <2 (Kallinowski et al., 1989) |
| Velocity (mm/s) | 1.55 ±0.12 | 1.62 ±0.14 | 1.56 ±0.13 | 0.85 ±0.05 | 0.1–25 (Brizel et al., 1993; Kamoun et al., 2010) |
| Shear Stress (dyn/cm2) | 17.4 ±0.5 | 23.9 ±0.7 | 22.5 ±0.6 | 11.72 ±0.21 | 10–100 (Pries et al., 2001a) |
|
Vascular Segment Transit Time - VSTT (s) |
1.42 ±0.04 | 0.97 ±0.03 | 1.08 ±0.03 | 2.4 ±0.04 | |
|
Hypoperfused Vessels (%) |
2.3 | 1.5 | 1.4 | 4.8 |
Hypoperfused vessels: VSTT>25s. 33% blind ends: 11.2/mm. 67% blind ends: 19.3/mm. 100% blind ends: 24.1/mm. Endothelial tip cell density during angiogenesis: 28/mm (Hellstrom et al., 2007).
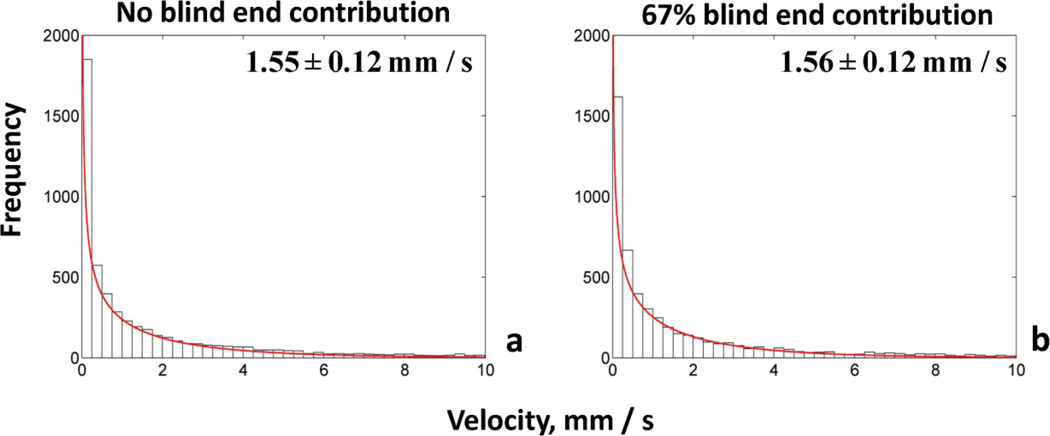
Fig. 9. Frequency distributions of flow velocities for two cases of blood flow simulations.
The frequency distribution of velocities (mm/s) is gamma function for both cases accounting for different percentage of blind end contribution to influx/efflux of tumor vascular network. (a) No blind ends, (b) 67% blind ends. The panels present the mean values and the confidence intervals.
Fig. 7. Discretized 3D whole-tumor perfusion map.
Three different perspectives of the 3D perfusion map for the tumor vascular network. A coarse spatial 3D grid has been overlaid to discretize the vascular network and provide an average perfusion estimate in 100×100×100 µm3 voxels. Perfusion units: ml/g tissue/min.
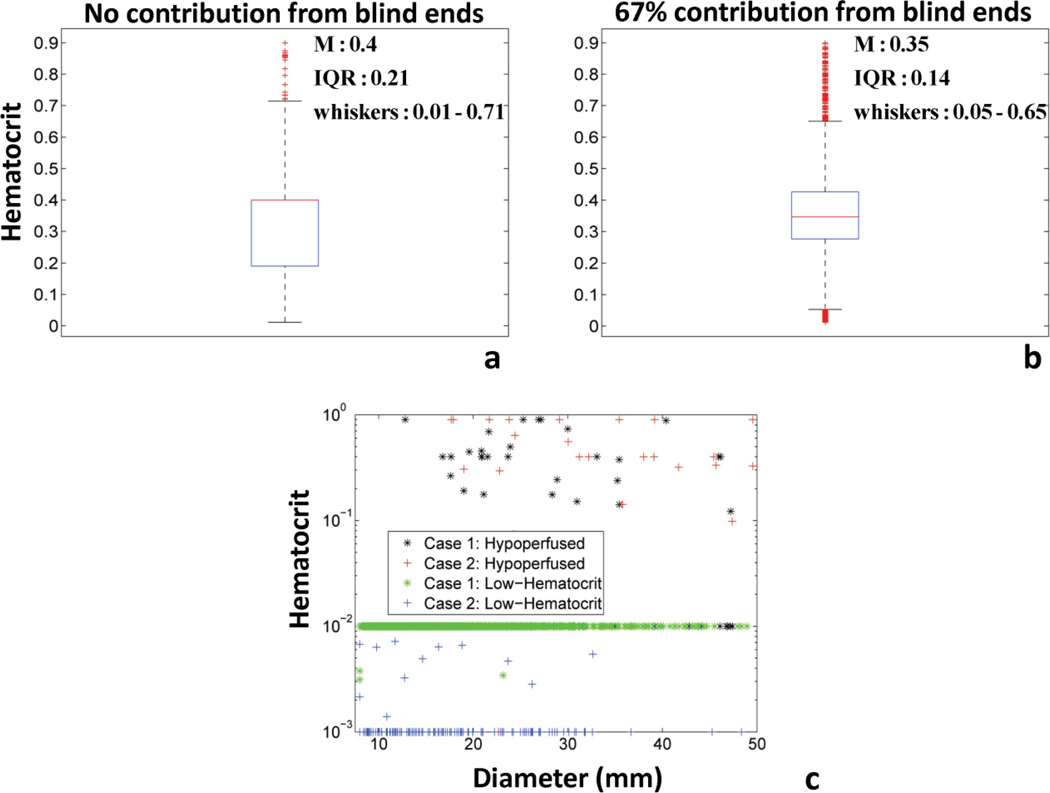
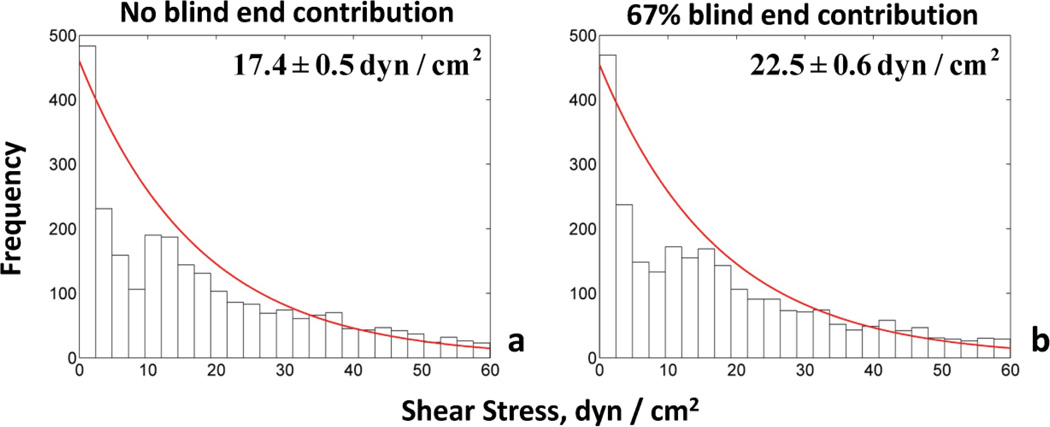
Fig. 8 presents the comparison of the hematocrit distribution and vessel clustering for two different cases based on different influx/efflux boundary conditions. The boxplots show that increased number of influx/efflux entities leads to a hematocrit distribution in the transport vessels (VSTT<25s, HD>0.01) that is grouped around 0.4 with more outliers (i.e. smaller IQR and whisker range in Fig. 8b) (Braun et al., 2002). In contrast, the omission of blind ends from the hemodynamic calculations led to a profile more skewed towards values smaller than 0.4 with fewer outliers (i.e. higher IQR and whisker range in Fig. 8a). Figure 8c showed that phenotypic clustering of hypoperfused (VSTT>25s) and low-hematocrit (HD<0.01) vessels can be performed for both cases based on hemodynamics. The empirical phenotyping clustering for perfused vs. unperfused vessel segments was based on whether their VSTT was an order of magnitude higher compared to the maximum of the mean VSTT values presented in Table 3. We believe that VSTT is a good indicator of hypoperfusion because it takes into account both flow and length information per vessel segment. The vessels with these characteristics span all diameter ranges, in agreement with results from Kamoun et al. (Kamoun et al., 2010). In Figs 9–10 frequency distributions of flow velocities and shear stresses in the tumor vascular network are presented. Gamma and exponential distributions describe these hemodynamic measures for all cases as confirmed by χ2 goodness of fit (p-value<0.01) and one-sample K-S tests (p-value<0.01). The confidence intervals of mean values were estimated through nonlinear regression analysis. The two-sample K-S test confirmed that all distributions were unique (p-value<0.01).
Fig. 8. Comparison of hematocrit variation and vessel clustering for two case studies of blood flow simulations.
(a) Boxplot of hematocrit variation of transport vessels for the Case 1: No blind end contribution to influx/efflux of tumor vascular network. (b) Boxplot of hematocrit variation of transport vessels for the Case 2: 67% of blind end contribution to influx/efflux of tumor vascular network. Red line in the boxplot presents the median value. The bottom and top of the box present the lower and upper quartiles (25th and 75th percentile respectively). The lower and upper whiskers present the 9th and 91st percentile of dispersion. (c) Scatter plot of hematocrit vs. segment diameter for both cases and different vessel sub-types: Hypoperfused (VSTT>25s) and low-hematocrit (HD<0.01).
Fig. 10. Frequency distributions of shear stress for two cases of blood flow simulations.
The frequency distribution of shear stress (dyn/cm2) is exponential for both cases accounting for different percentage of blind end contribution to influx/efflux of tumor vascular network. (a) No blind ends, (b) 67% blind ends. The panels present the mean values and the confidence intervals.
Morphological and Hemodynamic Comparison of ROI
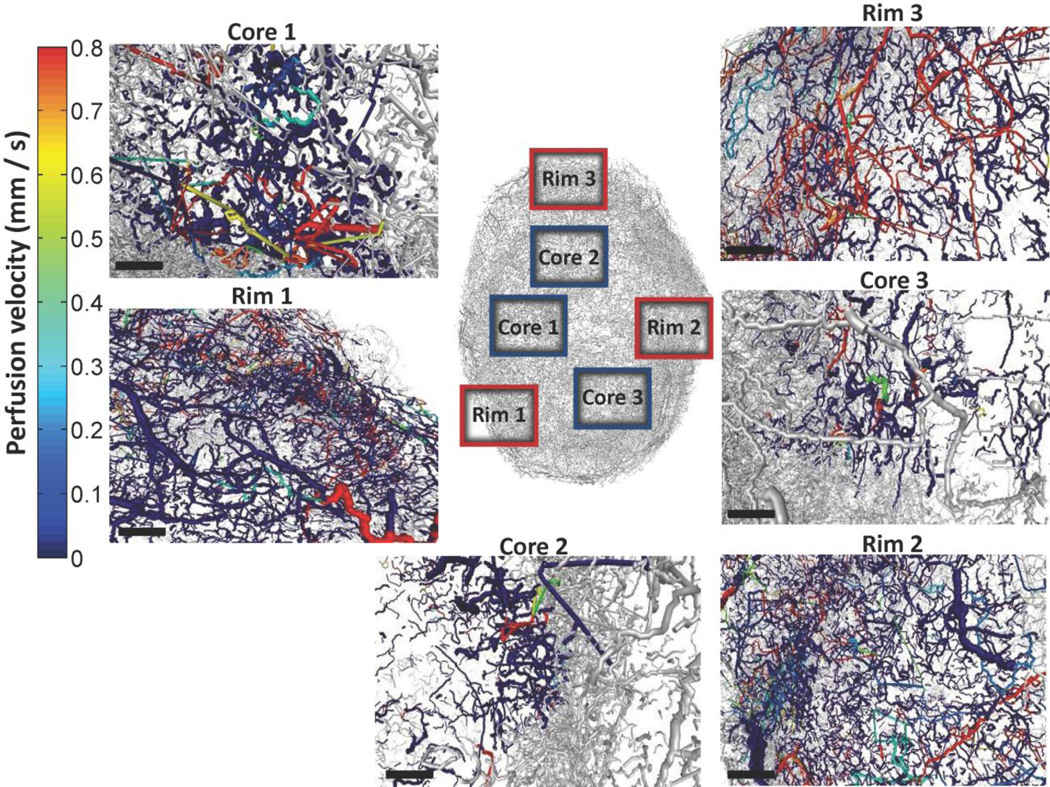
Table 4 summarizes the morphological parameters for the tumor vasculature extracted from six ROI defined in Fig. 11. Blood volume and vessel length density of ROI located in the periphery are significantly elevated compared to the whole vasculature, while the opposite was observed for parameters such as extravascular diffusion distance and fractal dimension. Two of the ROI (Core-2 and −3) close to the tumor center showed decreased blood volume and vessel length density and higher mean extravascular distance compared to the whole-tumor vascular network. ROI Core-1 showed comparable vessel length density and extravascular distance and increased vascular density compared to the whole network. For all core ROI, the fractal dimension ranged between 1.01 and 1.46 and in two cases (Core-2, Core-3) was close to 1. Therefore, core ROI appeared more irregular and less self-similar compared to peripheral ROI. In addition, all core ROI had decreased volume and length density compared to the peripheral ROI (Kim et al., 2012a), which was consistent with decreased space-filling capacity. Tortuosity was slightly influenced by the scale change (whole network vs. ROI) but remained in a similar range compared to other imaging studies (Vakoc et al., 2009). The ROI comparison highlighted the heterogeneity of geometric features across tumor vasculature; this was even more profound when comparing regions with different spatial locations (e.g. periphery vs. center).
Table 4.
Geometrical and fractal properties of six regions of interest from tumor vasculature.
| Properties | Core-1 | Rim-1 | Core-2 | Rim-2 | Core-3 | Rim-3 |
|---|---|---|---|---|---|---|
| Volume Density (%) | 0.9 | 3.4 | 0.38 | 2.06 | 0.2 | 1.08 |
| Length Density (mm/mm3) | 20.7 | 101.18 | 10.72 | 64.82 | 8.73 | 37.38 |
| Mean Diameter (µm) | 16.66 | 15.12 | 17.95 | 15.77 | 19.24 | 14.15 |
| Mean Length (mm) | 0.46 | 0.39 | 0.26 | 0.33 | 0.22 | 0.13 |
|
Maximum extravascular diffusion distance (µm) |
124.1 | 56.1 | 172 | 70 | 191 | 92.3 |
| Fractal Dimension | 1.46 | 1.45 | 1.1 | 1.55 | 1.01 | 1.29 |
| Tortuosity | 1.47 | 1.42 | 1.4 | 1.42 | 1.44 | 1.4 |
| Surface Density (mm2/mm3) | 1.4 | 5.44 | 0.64 | 3.53 | 0.47 | 1.93 |
Fig. 11. Regions of interest (ROI) for morphological and hemodynamic analysis.
The regions extracted from the rim and the cores are color-coded by velocity (mm/s), and are broadly comprised of 3 core ROI (Core1-3) and 3 rim ROI (Rim1-3). Scale bars: 400 µm.
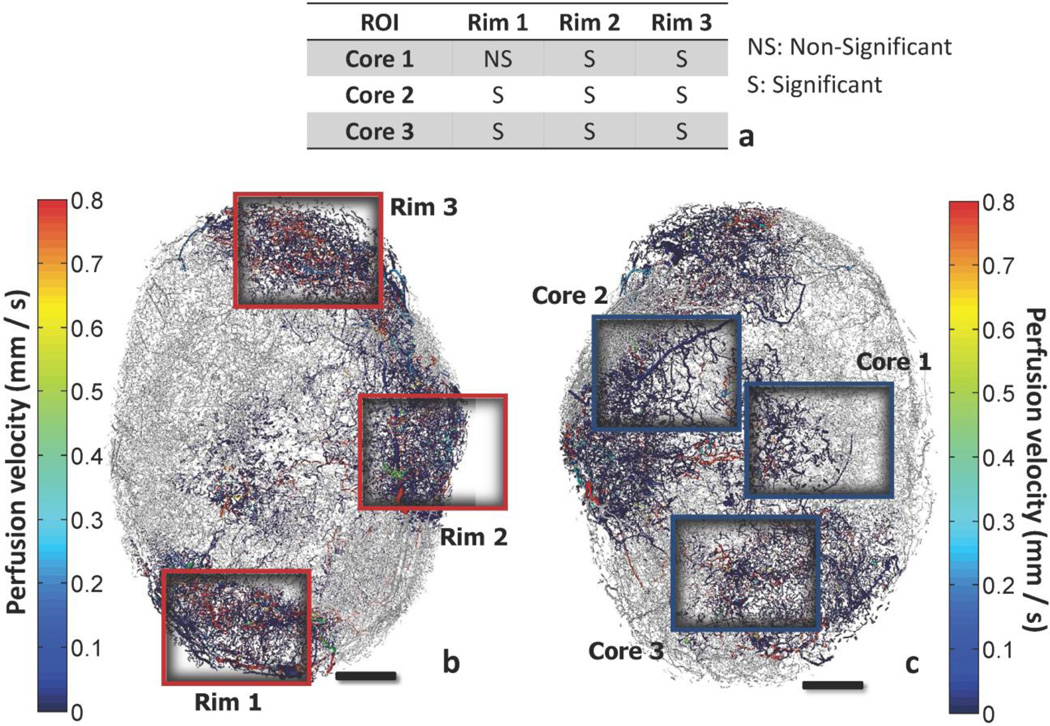
Fig. 12 presents the comparison of the flow velocity frequency distributions of Core-1, − 2, −3 vs. Rim-1, −2, −3 (inset table). The two-sample K-S test confirmed that the perfusion velocity was significantly different for all rim vs. core comparisons except Core-1 vs. Rim-1. In Table 5 hemodynamic metrics are reported to compare these ROI. The perfusion (ml/g/min) values for all ROI were in the same range as values reported in other imaging studies using PET (Beaney et al., 1984; Walenta et al., 1992), laser Doppler (Acker et al., 1990) or dynamic CT (Feldmann et al., 1992; Hirasawa et al., 2007; Jain et al., 2008; Park et al., 2009) in patients or animal xenograft models. Peripheral tumor regions were significantly better perfused compared to core regions. Rim-3 ROI exhibited perfusion which was even higher compared to the whole vascular network values. Rim-3 had similar range of velocities and shear stress levels compared to other peripheral regions but significantly smaller VSTT (Eq. 15) and hypoperfusion values. Among the core regions, Core-2 had perfusion value which was in the same range as mean whole-tumor vascular perfusion. This region also had the smaller VSTT range and percentage of hypoperfused vessels compared to Core-1 and −3. Core-2 had one of the lowest MPL values along with Core-3 and Rim-3, which is presumed to be indicative of hypoxia and functional shunting (Pries et al., 2010). The opposite was observed for Core-1 MPL value despite the minimal perfusion and high percentage of hypoperfused vessels.
Fig. 12. Comparison of velocity frequency distribution for core and rim regions of interest.
The regions which are extracted from the rim and the core of the tumor are presented color-coded by perfusion velocity (mm/s). The probability density distributions of velocities can be described by a gamma function for all regions. (a) Inset table comparing the velocity distributions with the two-sample K-S test. View of the vascular network annotating the position of rim regions (b) and core regions (c). Scale bars: 1 mm.
Table 5.
Hemodynamic properties of six regions of interest of tumor vasculature.
| Properties | ore-1 | Rim-1 | Core-2 | Rim-2 | Core-3 | Rim-3 |
|---|---|---|---|---|---|---|
|
Perfusion (ml/g/min) |
0.0014 | 0.2 | 0.14 | 0.84 | 0.0017 | 1.98 |
| Velocity (mm/s) | 0.25±0.12 | 0.20±0.04 | 0.12 ±0.05 | 0.18 ±0.03 | 0.12 ±0.06 | 0.17±0.03 |
|
Shear Stress (dyn/cm2) |
1.7 ±0.3 | 1.69 ±0.12 | 0.84 ±0.12 | 1.33 ±0.1 | 0.69 ±0.13 | 1.24±0.08 |
|
Mean Flow- weighted Path Length - MPL (mm) |
0.52 | 0.36 | 0.14 | 0.42 | 0.18 | 0.14 |
|
Mean Transit Time - VSTT (s) |
6.4±1.1 | 6.6 ±0.5 | 4.8±0.7 | 4.45 ±0.3 | 7.1±1.4 | 1.24±0.09 |
|
Hypoperfused Vessels (%) |
41.4 | 30 | 17 | 16 | 29 | 12.7 |
Hypoperfused vessels: VSTT>25s.
Discussion
We present the first combined bioimage informatics and computational modeling study to investigate the hemodynamics of a whole-tumor vascular network based on high-resolution 3D µCT data. Pioneering research by Rakesh Jain (Jain, 2008), Peter Vaupel (Vaupel, 2004) and others has shown that there is little resemblance between the microvasculature of normal and tumor networks. The standard differentiation among arterioles, venules and capillaries breaks down because of the disorganized and aberrant nature of the tumor vascular network (Nagy and Dvorak, 2012). Additionally, one of the most prevalent structural differences is the dilated diameters of all tumor vessels including the capillary-like ones. There are numerous studies investigating these issues both recently using high resolution imaging techniques such as multiphoton microscopy and optical frequency domain imaging (Kamoun et al., 2010; Vakoc et al., 2009), but also in previous decades using corrosion casting and microphotography (Less et al., 1991; Yuan et al., 1994). All of them indicate the very small percentage of vessels within the diameter range of normal capillaries. Consequently, based on the de facto structure of the tumor vascular network obtained from high-resolution 3D imaging and the underlying assumptions of our model, we were able to simulate perfusion for the whole tumor vascular network.
The fidelity of the reconstructed vascular network is dependent on the quality of vascular filling of Microfil, the µCT contrast agent. Microfil is widely employed in µCT studies because its hydrophobicity and low viscosity results in compartmentalization in the vascular space and excellent filling of microvessels (Bentley et al., 2002; Chugh et al., 2009). It is possible that contrast agent perfusion caused artificial dilation of blood vessels. However, the µCT-derived vessel radii measurements were within the range of histological measurements as presented in Table 2. Moreover, the hemodynamic predictions from our computational model were consistent with relevant hemodynamic measurements as presented in Table 3. All in all, these findings indicate that any artificial vessel dilation had minor effects to our results.
The 3D algorithm comprising several modules allows the pattern recognition and reconstruction of initially discontinuous raw imaging data based on a computer-aided image analysis approach (Danuser, 2011). The blood flow modeling involves a well-established model for the calculation of segment-by-segment blood flow, pressure, and hematocrit (Pries et al., 2009); in addition a detailed nonlinear optimization algorithm was developed to adjust the pressure boundary conditions to ensure mass balance. The predicted perfusion characteristics were generally consistent with experimentally measured values reported in the literature.
Use of all the backbone sub-network blind ends as pressure boundary conditions provided an upper limit for perfusion that was comparable to physiological values in gray matter (Rostrup et al., 2000). McDonald and co-authors (Morikawa et al., 2002) experimentally estimated the fraction of blind-ended sprouts in a sample of tumor vessels at approximately 33%. If we assume that these sprouts account for no-flow boundaries, then Case 3 of Table 3 is the most relevant. In this case, 67% of the blind ends were assigned a pressure value and 33% a no-flow boundary condition; in addition, this scenario seems more realistic since the average perfusion is well below the physiological range, but above the lower extreme (∼0.08 ml/g/min). The contradictory result of perfusion elevation with the consequent increase in VSTT and hypoperfusion of individual vessels can be attributed to the heterogeneity of the structure and the fact that these measures evaluate quantities at different scale. Perfusion is a bulk measure evaluating total blood flow rates in the network. The other measures result from estimation of hemodynamics in individual segments, and therefore contain finer scale information. Finally, such finding indicated that additional inlets (increased total perfusion) do not necessarily improve the flow in all segments of the tumor (Pries et al., 2009).
VSTT was estimated based on structural and hemodynamic calculations for each segment (Suppl. Fig. 5), and exhibited an exponential distribution with mean and confidence intervals as reported in Table 3. A possible explanation for this result is that segments with velocities (or flow rates) greater than the mean velocity mostly have length lower than the mean segment length. The reason why VSTT tends towards lower values under pathophysiological conditions is based on the structural characteristics of the tumor microvasculature and functional shunting. Namely, short pathways through the tumor vessel network are enlarged and offer routes of decreased resistance for blood flow compared to longer ones (Pries et al., 2010). This measure is not to be confused with the total mean transit time (MTT), which is a bulk measure widely reported in perfusion imaging studies (Jain et al., 2008). The MTT represents the average time needed for blood plasma to traverse the tumor vasculature, but does not provide any additional information on a segment-by-segment basis.
The comparison of perfusion among ROI confirms that the structural heterogeneity of tumor microvessels leads to functional abnormalities and hemodynamic variations (Pries et al., 2010). Despite the estimation of several 3D morphological and hemodynamic parameters, a direct global correlation of these metrics with perfusion is not feasible in the present study. The limited number of tumors in the present study precludes quantification of the variability in blood flow distribution. A significantly larger experimental sample is required to address that issue. These characteristics can facilitate assessment of tumor perfusion, but they cannot be used as biomarkers to predict antiangiogenic efficacy or ROI-targeted delivery of chemotherapeutics without further validation (Hlatky et al., 2002). On the other hand, an assessment of the variation of these parameters relative to each other can be beneficial for characterizing the differential perfusion in ROI under certain scenarios. For instance, Core-2 and Rim-2 have approximately the same percentage of hypoperfused vessels and similar VSTT but different perfusion (Table 5). Rim-2 (better perfused) has relatively higher vessel length density (Table 4). This relationship between length density and blood perfusion has been reported among different tumor samples as well as among regions of the same sample (Kim et al., 2011). Comparison of Core-2 and Core-3 ROI which have similar length and surface density, but different regional perfusion demonstrates the utility of hemodynamic measures such as VSTT and shear stress. It is worth mentioning the difference in VSTT, which was significantly lower for Core-2 compared to Core-3. Our estimates are in qualitative agreement with a recent perfusion CT imaging study in patients with pancreatic endocrine tumors. Patients without angioinvasion or lymph node metastasis and a proliferation index < 2% (i.e. number of cells that are dividing) seemed to have significantly lower MTT distribution compared to patients with angioinvasion, lymph metastasis and a proliferation index > 2% (d'Assignies et al., 2009). Another dynamic CT imaging study in patients with hepatocellular carcinoma revealed that patients unresponsive to bevacizumab had almost four times higher MTT compared to patients with steady disease or partial response to treatment (Zhu et al., 2008). In these cases there was a positive correlation between VSTT and MTT. This may be expected as tumor size and its vascular path lengths increase, but will not always be the case for smaller tumors or ROI.
Finally, despite the estimated perfusion in Core-1 (extremely low) the MPL value, which is postulated to be indicative of hypoxia (Pries et al., 2009), was very high. This ROI has small length density and high degree of hypoperfusion. A possible explanation for this prediction is that MPL takes into account the sum of flow rates, which may be extremely heterogeneous in the tumor. That is, few high flow paths close to each other would transport the blood and drain it out of the ROI while other areas would remain relatively isolated and minimally perfused. These high flow pathways also raise the average shear stress levels of the. A recent microfluidic study reported that endothelial cell shear stress inhibits sprouting when VEGF gradients are present (Song and Munn, 2011). In that case, MPL does not provide meaningful regional information and may not be appropriate for assessing functional shunting. This finding emphasizes the importance of hypoperfusion as a criterion for inferring tumor hypoxia.
The bioimage informatics methodology (Myers, 2012) presented here could be expanded in future studies to include spatiotemporal growth and remodeling of the tumor vasculature. It would be useful to reevaluate the application of steady state blood flow models in a system that has complex dynamics (Munn et al., 2012). Application of steady state models is common in microcirculatory systems (Popel and Johnson, 2005) but the complex fluid mechanics of tumor microcirculation might require alternative computational approaches (Koumoutsakos et al., 2013). For example, recent advances in discrete modeling of blood cells (e.g. lattice-Boltzmann and Dissipative Particle Dynamics methods) should enable simulations of blood cell interaction in realistic microvasculature (Fedosov et al., 2013; Sun and Munn, 2008; Yin et al., 2013).
This study is based on the analysis and extraction of useful biological information from high-resolution, 3D µCT data of the whole-tumor vasculature and enabled comparison of different ROI in terms of morphological and hemodynamic indices. Such a platform can facilitate the hemodynamic and structural evaluation of tumor vasculature at various stages of tumor progression. Moreover it can provide critical information about the relative significance of the various parameters under different therapeutic treatments or physiological conditions. The predictions of these computations can be further compared and validated with laser speckle blood flow imaging or other in vivo measurements of blood flow (Rege et al., 2012), and correlated with molecular measurements such as VEGF and GLUT-1 immunostaining (Kim et al., 2012b; Meisner et al., 2012). Finally, antiangiogenic and chemotherapeutic drug delivery strategies can be optimized using such a framework since it can potentially identify ROI that may be more amenable to therapeutic intervention since the chaotic tumor vasculature often impedes efficient drug delivery (Jain and Stylianopoulos, 2010). The computational algorithm we developed, in conjunction with multiscale imaging can be used to investigate the efficacy of antiangiogenic and anticancer agents on the tumor vasculature and provide guidance for their delivery (Lloyd et al., 2008; McDougall et al., 2002; Owen et al., 2011).
Supplementary Material
Highlights.
A bioimage informatics method is presented to reconstruct the tumor vasculature.
A hemodynamic model is used to estimate blood perfusion across the vasculature.
The results of the analysis are assessed with data from cancer xenograft models.
Comparison of morphology and hemodynamics is presented across vascular regions.
This computational platform enables assessment of tumor perfusion heterogeneity.
Acknowledgements
Research supported by NIH grant R01 CA138264 and Susan G. Komen for the Cure Grant KG090640. The authors would like to thank Dr. Corban Rivera for his help with Module 1 of the bioimage informatics algorithm and the useful discussions about traversal algorithms.
Nomenclature and Abbreviations
- Adjacency Matrix
A symmetric matrix consisting of ones and zeros indicating whether or not 2 nodes are connected with a segment
- BFS
breadth-first search traversal algorithm (systematic visiting of nodes and segments of the graph)
- DFS
depth-first search traversal algorithm (systematic visiting of nodes and segments of the graph)
- D
segment diameter
- G
hydraulic conductance
- IQR
interquartile range (measure of data dispersion)
- L
segment length
- LD
vascular length density
- mtissue
mass of tumor tissue
- Minimum Heap
tree-based data structure where the parent nodes have always an identity (key) smaller than their children nodes
- MPL
flow-weighted mean path length
- MTT
total mean transit time
- N
total number of segments
- P
pressure
- Priority Queue
data structure where each element is served based on a predefined priority
- Q
flow rate
- R
maximum extravascular diffusion distance of oxygen
- ROI
regions of interest
- SD
vascular surface density
- S/V
ratio of vascular surface area over vascular volume
- Segment Morphology
A vector storing the length and diameter of each individual segment of the vasculature
- u
mean velocity
- VD
vascular volume density
- Vtissue
volume of tumor tissue
- VSTT
vascular segment transit time
Greek Letters
- µ
apparent viscosity
- µCT
micro-computed tomography
- τ
vascular wall shear stress
Subscript
- b
boundary segments
- int
internal segments
- in
inlet feeding segments
- ij
segment between nodes i and j
Footnotes
Publisher's Disclaimer: This is a PDF file of an unedited manuscript that has been accepted for publication. As a service to our customers we are providing this early version of the manuscript. The manuscript will undergo copyediting, typesetting, and review of the resulting proof before it is published in its final citable form. Please note that during the production process errors may be discovered which could affect the content, and all legal disclaimers that apply to the journal pertain.
References
- Acker JC, et al. Blood perfusion measurements in human tumours: evaluation of laser Doppler methods. Int J Hyperthermia. 1990;6:287–304. doi: 10.3109/02656739009141139. [DOI] [PubMed] [Google Scholar]
- Baish JW, et al. Scaling rules for diffusive drug delivery in tumor and normal tissues. Proc Natl Acad Sci U S A. 2011;108:1799–1803. doi: 10.1073/pnas.1018154108. [DOI] [PMC free article] [PubMed] [Google Scholar]
- Beaney RP, et al. Positron emission tomography for in-vivo measurement of regional blood flow, oxygen utilisation, and blood volume in patients with breast carcinoma. Lancet. 1984;1:131–134. doi: 10.1016/s0140-6736(84)90063-1. [DOI] [PubMed] [Google Scholar]
- Benedict KF, et al. Hemodynamic systems analysis of capillary network remodeling during the progression of type 2 diabetes. Microcirculation. 2011;18:63–73. doi: 10.1111/j.1549-8719.2010.00069.x. [DOI] [PubMed] [Google Scholar]
- Bentley MD, et al. The use of microcomputed tomography to study microvasculature in small rodents. Am J Physiol Regul Integr Comp Physiol. 2002;282:R1267–R1279. doi: 10.1152/ajpregu.00560.2001. [DOI] [PubMed] [Google Scholar]
- Bowden DJ, Barrett T. Angiogenesis imaging in neoplasia. J Clin Imaging Sci. 2011;1:38. doi: 10.4103/2156-7514.83229. [DOI] [PMC free article] [PubMed] [Google Scholar]
- Braun RD, et al. Hemodynamic parameters in blood vessels in choroidal melanoma xenografts and rat choroid. Invest Ophthalmol Vis Sci. 2002;43:3045–3052. [PMC free article] [PubMed] [Google Scholar]
- Brizel DM, et al. A comparison of tumor and normal tissue microvascular hematocrits and red cell fluxes in a rat window chamber model. Int J Radiat Oncol Biol Phys. 1993;25:269–276. doi: 10.1016/0360-3016(93)90348-y. [DOI] [PubMed] [Google Scholar]
- Chugh BP, et al. Measurement of cerebral blood volume in mouse brain regions using microcomputed tomography. Neuroimage. 2009;47:1312–1318. doi: 10.1016/j.neuroimage.2009.03.083. [DOI] [PubMed] [Google Scholar]
- d'Assignies G, et al. Pancreatic endocrine tumors: tumor blood flow assessed with perfusion CT reflects angiogenesis and correlates with prognostic factors. Radiology. 2009;250:407–416. doi: 10.1148/radiol.2501080291. [DOI] [PubMed] [Google Scholar]
- Dale MRT, Fortin MJ. From Graphs to Spatial Graphs. Annu Rev Ecol Evol S. 2010;41:21–38. [Google Scholar]
- Danuser G. Computer vision in cell biology. Cell. 2011;147:973–978. doi: 10.1016/j.cell.2011.11.001. [DOI] [PubMed] [Google Scholar]
- Dawant B, et al. Effect of dispersion of vessel diameters and lengths in stochastic networks. I. Modeling of microcirculatory flow. Microvasc Res. 1986;31:203–222. doi: 10.1016/0026-2862(86)90035-x. [DOI] [PubMed] [Google Scholar]
- Fedosov DA, et al. Multiscale modeling of blood flow: from single cells to blood rheology. Biomech Model Mechanobiol. 2013 doi: 10.1007/s10237-013-0497-9. [DOI] [PubMed] [Google Scholar]
- Feldmann HJ, et al. Blood flow and steady state temperatures in deep-seated tumors and normal tissues. Int J Radiat Oncol Biol Phys. 1992;23:1003–1008. doi: 10.1016/0360-3016(92)90906-x. [DOI] [PubMed] [Google Scholar]
- Fry BC, et al. Estimation of blood flow rates in large microvascular networks. Microcirculation. 2012;19:530–538. doi: 10.1111/j.1549-8719.2012.00184.x. [DOI] [PMC free article] [PubMed] [Google Scholar]
- Ganesan P, et al. Development of an image-based network model of retinal vasculature. Ann Biomed Eng. 2010;38:1566–1585. doi: 10.1007/s10439-010-9942-4. [DOI] [PubMed] [Google Scholar]
- Gaustad JV, et al. Blood supply in melanoma xenografts is governed by the morphology of the supplying arteries. Neoplasia. 2009;11:277–285. doi: 10.1593/neo.81400. [DOI] [PMC free article] [PubMed] [Google Scholar]
- Gould DJ, Reece GP. Skin graft vascular maturation and remodeling: a multifractal approach to morphological quantification. Microcirculation. 2012;19:652–663. doi: 10.1111/j.1549-8719.2012.00200.x. [DOI] [PMC free article] [PubMed] [Google Scholar]
- Guibert R, et al. On the normalization of cerebral blood flow. J Cereb Blood Flow Metab. 2013;33:669–672. doi: 10.1038/jcbfm.2013.39. [DOI] [PMC free article] [PubMed] [Google Scholar]
- Guibert R, et al. Cerebral blood flow modeling in primate cortex. J Cereb Blood Flow Metab. 2010;30:1860–1873. doi: 10.1038/jcbfm.2010.105. [DOI] [PMC free article] [PubMed] [Google Scholar]
- Hanahan D, Weinberg RA. Hallmarks of cancer: the next generation. Cell. 2011;144:646–674. doi: 10.1016/j.cell.2011.02.013. [DOI] [PubMed] [Google Scholar]
- Hashizume H, et al. Openings between defective endothelial cells explain tumor vessel leakiness. Am J Pathol. 2000;156:1363–1380. doi: 10.1016/S0002-9440(10)65006-7. [DOI] [PMC free article] [PubMed] [Google Scholar]
- Hellstrom M, et al. Dll4 signalling through Notch1 regulates formation of tip cells during angiogenesis. Nature. 2007;445:776–780. doi: 10.1038/nature05571. [DOI] [PubMed] [Google Scholar]
- Hirasawa H, et al. Perfusion CT of breast carcinoma: arterial perfusion of nonscirrhous carcinoma was higher than that of scirrhous carcinoma. Acad Radiol. 2007;14:547–552. doi: 10.1016/j.acra.2007.01.013. [DOI] [PubMed] [Google Scholar]
- Hirsch S, et al. Topology and hemodynamics of the cortical cerebrovascular system. J Cereb Blood Flow Metab. 2012;32:952–967. doi: 10.1038/jcbfm.2012.39. [DOI] [PMC free article] [PubMed] [Google Scholar]
- Hlatky L, et al. Clinical application of antiangiogenic therapy: microvessel density, what it does and doesn't tell us. J Natl Cancer Inst. 2002;94:883–893. doi: 10.1093/jnci/94.12.883. [DOI] [PubMed] [Google Scholar]
- Jain R, et al. Quantitative estimation of permeability surface-area product in astroglial brain tumors using perfusion CT and correlation with histopathologic grade. AJNR Am J Neuroradiol. 2008;29:694–700. doi: 10.3174/ajnr.A0899. [DOI] [PMC free article] [PubMed] [Google Scholar]
- Jain RK. Taming vessels to treat cancer. Sci Am. 2008;298:56–63. doi: 10.1038/scientificamerican0108-56. [DOI] [PubMed] [Google Scholar]
- Jain RK, Stylianopoulos T. Delivering nanomedicine to solid tumors. Nat Rev Clin Oncol. 2010;7:653–664. doi: 10.1038/nrclinonc.2010.139. [DOI] [PMC free article] [PubMed] [Google Scholar]
- Jaqaman K, et al. Cytoskeletal control of CD36 diffusion promotes its receptor and signaling function. Cell. 2011;146:593–606. doi: 10.1016/j.cell.2011.06.049. [DOI] [PMC free article] [PubMed] [Google Scholar]
- Ji JW, et al. A computational model of oxygen transport in skeletal muscle for sprouting and splitting modes of angiogenesis. J Theor Biol. 2006;241:94–108. doi: 10.1016/j.jtbi.2005.11.019. [DOI] [PubMed] [Google Scholar]
- Ji L, et al. Fluctuations of intracellular forces during cell protrusion. Nat Cell Biol. 2008;10:1393–1400. doi: 10.1038/ncb1797. [DOI] [PMC free article] [PubMed] [Google Scholar]
- Kallinowski F, et al. Tumor blood flow: the principal modulator of oxidative and glycolytic metabolism, and of the metabolic micromilieu of human tumor xenografts in vivo. Int J Cancer. 1989;44:266–272. doi: 10.1002/ijc.2910440214. [DOI] [PubMed] [Google Scholar]
- Kamoun WS, et al. Simultaneous measurement of RBC velocity, flux, hematocrit and shear rate in vascular networks. Nat Methods. 2010;7:655–660. doi: 10.1038/nmeth.1475. [DOI] [PMC free article] [PubMed] [Google Scholar]
- Kim E, et al. Assessing breast cancer angiogenesis in vivo: Which susceptibility contrast MRI biomarkers are relevant? Magn Reson Med. 2012a doi: 10.1002/mrm.24530. [DOI] [PubMed] [Google Scholar]
- Kim E, et al. Multiscale imaging and computational modeling of blood flow in the tumor vasculature. Ann Biomed Eng. 2012b;40:2425–2441. doi: 10.1007/s10439-012-0585-5. [DOI] [PMC free article] [PubMed] [Google Scholar]
- Kim E, et al. Vascular phenotyping of brain tumors using magnetic resonance microscopy (muMRI) J Cereb Blood Flow Metab. 2011;31:1623–1636. doi: 10.1038/jcbfm.2011.17. [DOI] [PMC free article] [PubMed] [Google Scholar]
- Konerding MA, et al. Evidence for characteristic vascular patterns in solid tumours: quantitative studies using corrosion casts. Br J Cancer. 1999;80:724–732. doi: 10.1038/sj.bjc.6690416. [DOI] [PMC free article] [PubMed] [Google Scholar]
- Koumoutsakos P, et al. The Fluid Mechanics of Cancer and Its Therapy. Annu Rev Fluid Mech. 2013;45:325–355. [Google Scholar]
- Lee J, Smith N. Development and application of a one-dimensional blood flow model for microvascular networks. Proc Inst Mech Eng H. 2008;222:487–511. doi: 10.1243/09544119JEIM308. [DOI] [PubMed] [Google Scholar]
- Less JR, et al. Geometric resistance and microvascular network architecture of human colorectal carcinoma. Microcirculation. 1997;4:25–33. doi: 10.3109/10739689709148315. [DOI] [PubMed] [Google Scholar]
- Less JR, et al. Microvascular architecture in a mammary carcinoma: branching patterns and vessel dimensions. Cancer Res. 1991;51:265–273. [PubMed] [Google Scholar]
- Levin M, et al. Effect of dispersion of vessel diameters and lengths in stochastic networks. II. Modeling of microvascular hematocrit distribution. Microvasc Res. 1986;31:223–234. doi: 10.1016/0026-2862(86)90036-1. [DOI] [PubMed] [Google Scholar]
- Lloyd BA, et al. A computational framework for modelling solid tumour growth. Philos Trans A Math Phys Eng Sci. 2008;366:3301–3318. doi: 10.1098/rsta.2008.0092. [DOI] [PubMed] [Google Scholar]
- Lorthois S, et al. Simulation study of brain blood flow regulation by intra-cortical arterioles in an anatomically accurate large human vascular network: Part I: methodology and baseline flow. Neuroimage. 2011;54:1031–1042. doi: 10.1016/j.neuroimage.2010.09.032. [DOI] [PubMed] [Google Scholar]
- McDougall SR, et al. Mathematical modelling of flow through vascular networks: implications for tumour-induced angiogenesis and chemotherapy strategies. Bull Math Biol. 2002;64:673–702. doi: 10.1006/bulm.2002.0293. [DOI] [PubMed] [Google Scholar]
- Meisner JK, et al. Laser speckle flowmetry method for measuring spatial and temporal hemodynamic alterations throughout large microvascular networks. Microcirculation. 2012;19:619–631. doi: 10.1111/j.1549-8719.2012.00197.x. [DOI] [PMC free article] [PubMed] [Google Scholar]
- Moisy F. Boxcount. MATLAB Central. 2006 http://www.mathworks.com/matlabcentral/fileexchange/13063.
- Morikawa S, et al. Abnormalities in pericytes on blood vessels and endothelial sprouts in tumors. Am J Pathol. 2002;160:985–1000. doi: 10.1016/S0002-9440(10)64920-6. [DOI] [PMC free article] [PubMed] [Google Scholar]
- Munn LL, et al. Modeling Tumor Vasculature. In: Jackson ETL, editor. Modeling Structural and Functional Adaptation of Tumor Vessel Networks During Antiangiogenic Therapy. 2012. [Google Scholar]
- Myers G. Why bioimage informatics matters. Nat Methods. 2012;9:659–660. doi: 10.1038/nmeth.2024. [DOI] [PubMed] [Google Scholar]
- Nagy JA, et al. Vascular hyperpermeability, angiogenesis, and stroma generation. Cold Spring Harb Perspect Med. 2012;2 doi: 10.1101/cshperspect.a006544. a006544. [DOI] [PMC free article] [PubMed] [Google Scholar]
- Nagy JA, Dvorak HF. Heterogeneity of the tumor vasculature: the need for new tumor blood vessel type-specific targets. Clin Exp Metastasis. 2012;29:657–662. doi: 10.1007/s10585-012-9500-6. [DOI] [PMC free article] [PubMed] [Google Scholar]
- Owen MR, et al. Mathematical modeling predicts synergistic antitumor effects of combining a macrophage-based, hypoxia-targeted gene therapy with chemotherapy. Cancer Res. 2011;71:2826–2837. doi: 10.1158/0008-5472.CAN-10-2834. [DOI] [PMC free article] [PubMed] [Google Scholar]
- Park CM, et al. FN13762 murine breast cancer: region-by-region correlation of first-pass perfusion CT indexes with histologic vascular parameters. Radiology. 2009;251:721–730. doi: 10.1148/radiol.2513081215. [DOI] [PubMed] [Google Scholar]
- Pathak AP, et al. Three-dimensional imaging of the mouse neurovasculature with magnetic resonance microscopy. PLoS One. 2011;6:e22643. doi: 10.1371/journal.pone.0022643. [DOI] [PMC free article] [PubMed] [Google Scholar]
- Peng H. Bioimage informatics: a new area of engineering biology. Bioinformatics. 2008;24:1827–1836. doi: 10.1093/bioinformatics/btn346. [DOI] [PMC free article] [PubMed] [Google Scholar]
- Peng H, et al. V3D enables real-time 3D visualization and quantitative analysis of large-scale biological image data sets. Nat Biotechnol. 2010;28:348–353. doi: 10.1038/nbt.1612. [DOI] [PMC free article] [PubMed] [Google Scholar]
- Popel AS. A Model of Pressure and Flow Distribution in Branching Networks. J Appl Mech-T Asme. 1980;47:247–253. doi: 10.1115/1.3153650. [DOI] [PMC free article] [PubMed] [Google Scholar]
- Popel AS, Johnson PC. Microcirculation and Hemorheology. Annu Rev Fluid Mech. 2005;37:43–69. doi: 10.1146/annurev.fluid.37.042604.133933. [DOI] [PMC free article] [PubMed] [Google Scholar]
- Pries AR, et al. Structural adaptation and heterogeneity of normal and tumor microvascular networks. PLoS Comput Biol. 2009;5:e1000394. doi: 10.1371/journal.pcbi.1000394. [DOI] [PMC free article] [PubMed] [Google Scholar]
- Pries AR, et al. The shunt problem: control of functional shunting in normal and tumour vasculature. Nat Rev Cancer. 2010;10:587–593. doi: 10.1038/nrc2895. [DOI] [PMC free article] [PubMed] [Google Scholar]
- Pries AR, et al. Structural adaptation of microvascular networks: functional roles of adaptive responses. Am J Physiol Heart Circ Physiol. 2001a;281:H1015–H1025. doi: 10.1152/ajpheart.2001.281.3.H1015. [DOI] [PubMed] [Google Scholar]
- Pries AR, et al. Structural adaptation of vascular networks: role of the pressure response. Hypertension. 2001b;38:1476–1479. doi: 10.1161/hy1201.100592. [DOI] [PubMed] [Google Scholar]
- Pries AR, et al. Structural response of microcirculatory networks to changes in demand: information transfer by shear stress. Am J Physiol Heart Circ Physiol. 2003;284:H2204–H2212. doi: 10.1152/ajpheart.00757.2002. [DOI] [PubMed] [Google Scholar]
- Pries AR, Secomb TW. Rheology of the microcirculation. Clin Hemorheol Microcirc. 2003;29:143–148. [PubMed] [Google Scholar]
- Pries AR, et al. Structure and hemodynamics of microvascular networks: heterogeneity and correlations. Am J Physiol. 1995;269:H1713–H1722. doi: 10.1152/ajpheart.1995.269.5.H1713. [DOI] [PubMed] [Google Scholar]
- Pries AR, et al. Blood flow in microvascular networks. Experiments and simulation. Circ Res. 1990;67:826–834. doi: 10.1161/01.res.67.4.826. [DOI] [PubMed] [Google Scholar]
- Pries AR, et al. Resistance to blood flow in microvessels in vivo. Circ Res. 1994;75:904–915. doi: 10.1161/01.res.75.5.904. [DOI] [PubMed] [Google Scholar]
- Rege A, et al. In vivo laser speckle imaging reveals microvascular remodeling and hemodynamic changes during wound healing angiogenesis. Angiogenesis. 2012;15:87–98. doi: 10.1007/s10456-011-9245-x. [DOI] [PMC free article] [PubMed] [Google Scholar]
- Reichold J, et al. Vascular graph model to simulate the cerebral blood flow in realistic vascular networks. J Cereb Blood Flow Metab. 2009;29:1429–1443. doi: 10.1038/jcbfm.2009.58. [DOI] [PubMed] [Google Scholar]
- Rostrup E, et al. Regional differences in the CBF and BOLD responses to hypercapnia: a combined PET and fMRI study. Neuroimage. 2000;11:87–97. doi: 10.1006/nimg.1999.0526. [DOI] [PubMed] [Google Scholar]
- Saad Y, Schultz MH. Gmres - a Generalized Minimal Residual Algorithm for Solving Nonsymmetric Linear-Systems. Siam J Sci Stat Comp. 1986;7:856–869. [Google Scholar]
- Sabir A, et al. Perfusion MDCT enables early detection of therapeutic response to antiangiogenic therapy. AJR Am J Roentgenol. 2008;191:133–139. doi: 10.2214/AJR.07.2848. [DOI] [PubMed] [Google Scholar]
- Safaeian N, et al. A computational model of hemodynamic parameters in cortical capillary networks. J Theor Biol. 2010 doi: 10.1016/j.jtbi.2010.11.038. [DOI] [PubMed] [Google Scholar]
- Secomb TW, et al. Structural adaptation of normal and tumour vascular networks. Basic Clin Pharmacol Toxicol. 2012;110:63–69. doi: 10.1111/j.1742-7843.2011.00815.x. [DOI] [PMC free article] [PubMed] [Google Scholar]
- Sitohy B, et al. Anti-VEGF/VEGFR therapy for cancer: reassessing the target. Cancer Res. 2012;72:1909–1914. doi: 10.1158/0008-5472.CAN-11-3406. [DOI] [PMC free article] [PubMed] [Google Scholar]
- Song JW, Munn LL. Fluid forces control endothelial sprouting. Proc Natl Acad Sci U S A. 2011;108:15342–1537. doi: 10.1073/pnas.1105316108. [DOI] [PMC free article] [PubMed] [Google Scholar]
- Sun C, Munn LL. Lattice Boltzmann simulation of blood flow in digitized vessel networks. Comput Math Appl. 2008;55:1594–1600. doi: 10.1016/j.camwa.2007.08.019. [DOI] [PMC free article] [PubMed] [Google Scholar]
- Tyrrell JA, et al. Robust 3-D modeling of vasculature imagery using superellipsoids. IEEE Trans Med Imaging. 2007;26:223–237. doi: 10.1109/TMI.2006.889722. [DOI] [PubMed] [Google Scholar]
- Vakoc BJ, et al. Three-dimensional microscopy of the tumor microenvironment in vivo using optical frequency domain imaging. Nat Med. 2009;15:1219–1223. doi: 10.1038/nm.1971. [DOI] [PMC free article] [PubMed] [Google Scholar]
- Vaupel P. Tumor microenvironmental physiology and its implications for radiation oncology. Semin Radiat Oncol. 2004;14:198–206. doi: 10.1016/j.semradonc.2004.04.008. [DOI] [PubMed] [Google Scholar]
- Walenta S, et al. Pixel-to-pixel correlation between images of absolute ATP concentrations and blood flow in tumours. Br J Cancer. 1992;66:1099–1102. doi: 10.1038/bjc.1992.417. [DOI] [PMC free article] [PubMed] [Google Scholar]
- Yang J, et al. Comparative structural and hemodynamic analysis of vascular trees. Am J Physiol Heart Circ Physiol. 2010;298:H1249–H1259. doi: 10.1152/ajpheart.00363.2009. [DOI] [PubMed] [Google Scholar]
- Yin X, et al. Multiple red blood cell flows through microvascular bifurcations: Cell free layer, cell trajectory, and hematocrit separation. Microvasc Res. 2013 doi: 10.1016/j.mvr.2013.05.002. [DOI] [PubMed] [Google Scholar]
- Yuan F, et al. Vascular permeability and microcirculation of gliomas and mammary carcinomas transplanted in rat and mouse cranial windows. Cancer Res. 1994;54:4564–4568. [PubMed] [Google Scholar]
- Zhu AX, et al. Early antiangiogenic activity of bevacizumab evaluated by computed tomography perfusion scan in patients with advanced hepatocellular carcinoma. Oncologist. 2008;13:120–125. doi: 10.1634/theoncologist.2007-0174. [DOI] [PubMed] [Google Scholar]
Associated Data
This section collects any data citations, data availability statements, or supplementary materials included in this article.


