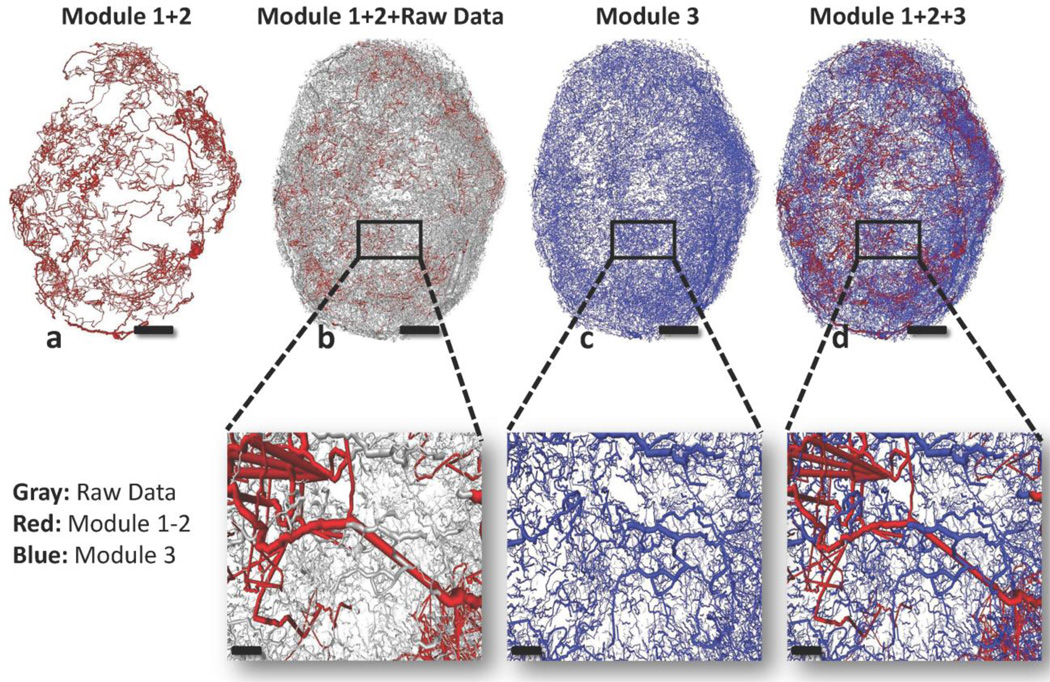
Fig. 4. Sequence of output images illustrating the microvascular network reconstructed by the 3D tracking algorithm.
(a) Red segments represent the connected backbone sub-network tracked by Modules 1 and 2. (b) Grey segments represent the raw data which were not captured by Modules 1 and 2. (c) Blue segments represent the unconnected segments tracked by Module 3. (d) Red and blue segments are integrated and provide the final structure of the vasculature. Panels scale bar: 1 mm. Insets scale bar: 200 µm.

