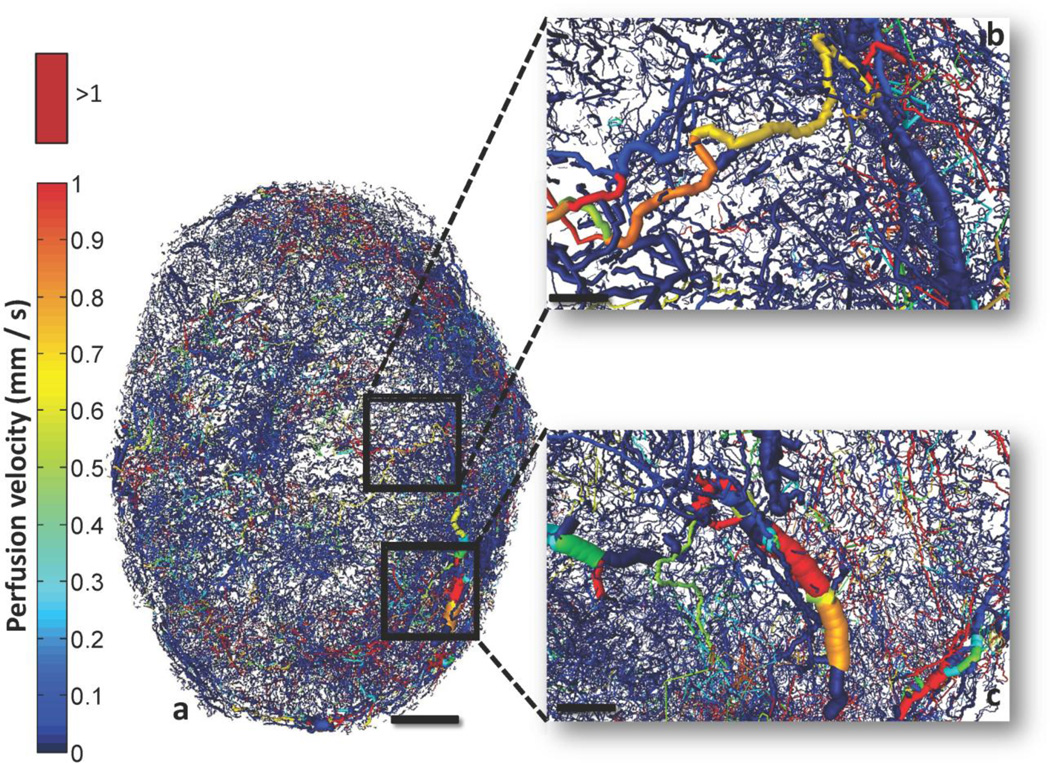
Fig. 6. Whole-tumor perfusion map.
(a) Detailed perfusion map of the whole-tumor vascular network color-coded by perfusion velocity (mm/s). (b) and (c) insets illustrate a magnified 3D perspective of different regions of tumor vasculature color-coded by perfusion velocity. Perfusion velocities >1 mm/s are color-coded bright red. Scale bars: 1 mm (a), 200 µm (b) and (c).

