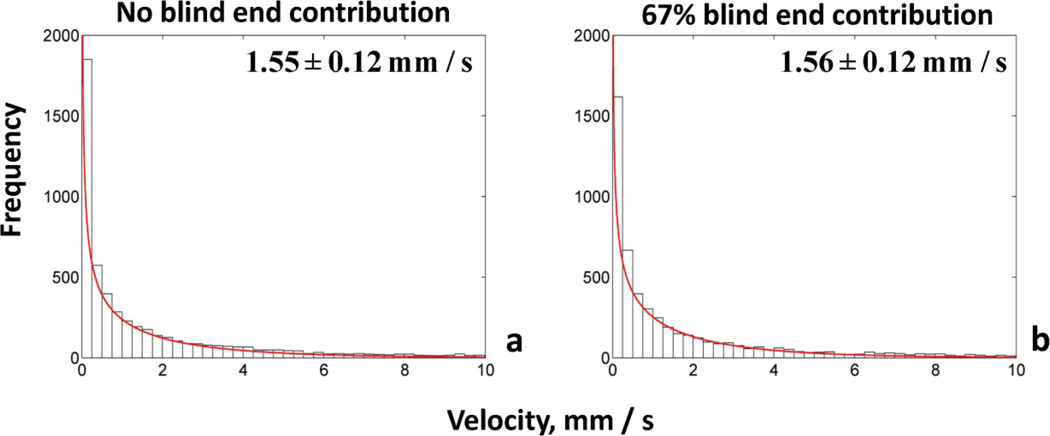
Fig. 9. Frequency distributions of flow velocities for two cases of blood flow simulations.
The frequency distribution of velocities (mm/s) is gamma function for both cases accounting for different percentage of blind end contribution to influx/efflux of tumor vascular network. (a) No blind ends, (b) 67% blind ends. The panels present the mean values and the confidence intervals.

