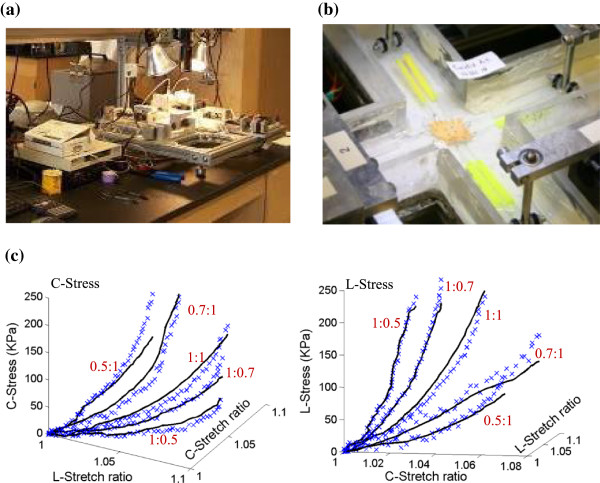
Figure 5.
The biaxial testing apparatus and sample results showing 3D plots of measured stress-stretch data from a human carotid sample with fitting curves by the anisotropic Mooney-Rivlin model. (a) The biaxial testing apparatus; (b) Tissue sample mounted for biaxial test; (c) Anisotropic stress-stretch data from a human coronary sample.

