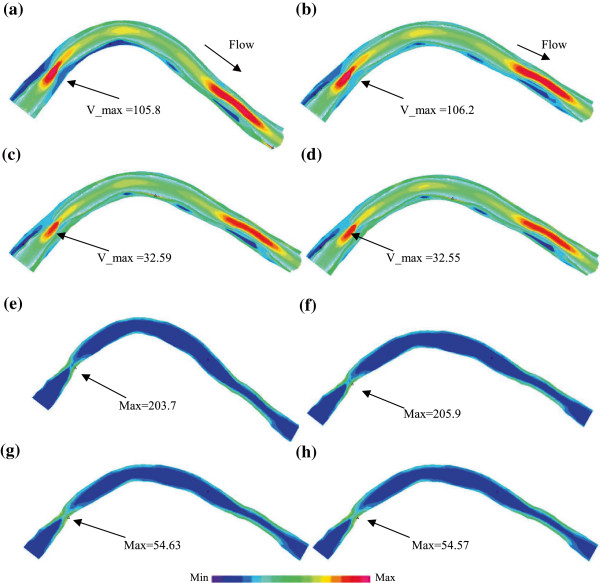
Figure 9.
Plots of flow velocity and flow shear stress from M1 and M2 showing the effect of curvature variations on stress and strain distributions. M1 and M2 were defined as before. (a) M1, Velocity + PWS, max bending, Pin=112 mmHg; (b) M2, Velocity + PWS, no cyclic bending, Pin=112 mmHg; (c) M1, Velocity + PWS, min bending, Pin=72 mmHg; (d) M2, Velocity + PWS, No cyclic bending, Pin=72 mmHg; (e) M1, Flow shear stress, max bending, Pin=112 mmHg; (f) M2, Flow shear stress, no cyclic bending, Pin=112 mmHg; (g) M1, Flow shear stress, min bending, Pin=72 mmHg; (h) M2, Flow shear stress, no cyclic bending, Pin=72 mmHg.

