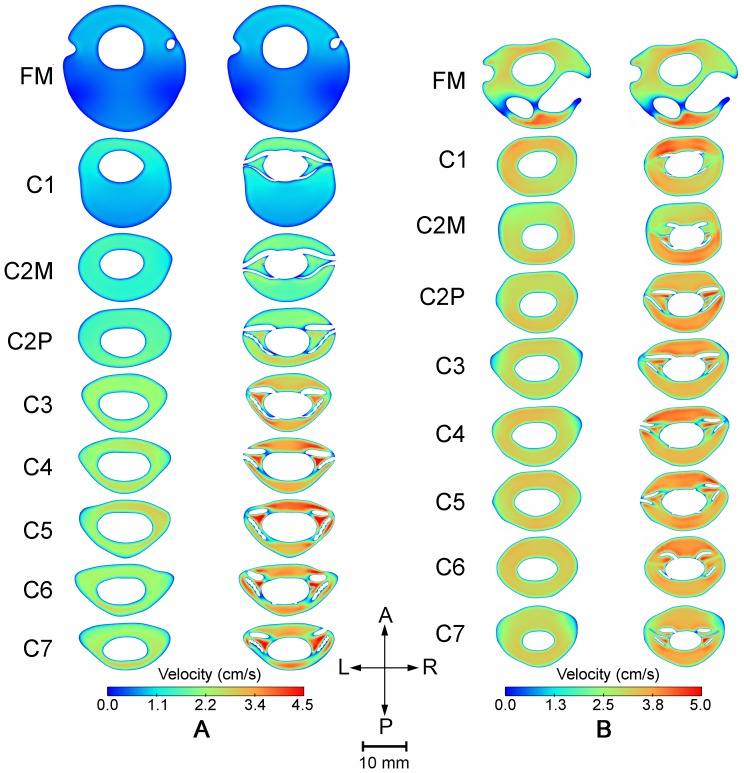
Figure 5. Velocity magnitude contours at different locations along cervical SSS plotted at the time corresponding to the peak systole for the healthy case (A) and patient diagnosed with Chiari I malformation (B).
In each set of contours, the left and right column represent the results for cases without and with NRDL, respectively.

