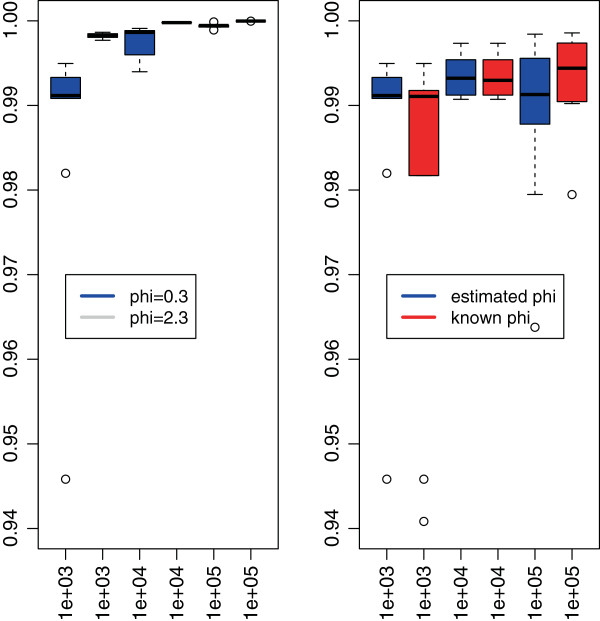
Figure 4.
Rand Index for the quality of the segmentation. This figure displays the boxplot of the Rand Index computed for each of the hundred simulations performed in the following situations: comparing the values with ϕ1 and ϕ2 when estimated (left figure), and comparing the impact of estimating ϕ1 (right figure). While the estimation does not decrease the quality of the segmentation, the value of the dispersion affects the recovery of the true change-points.

