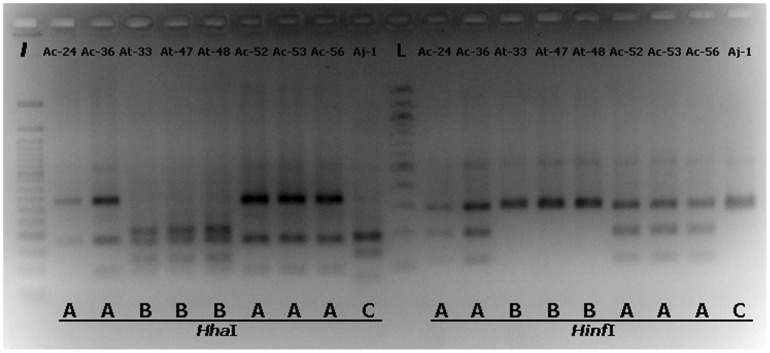
Figure 3. Ribosomal 5.8S-ITS region restriction digestion patterns of Aspergillus grape isolates.
Restriction digestion patterns (designated as A, B and C) of ribosomal 5.8S-ITS DNA amplicons from various Aspergilli grape isolates (presented as isolate designations), after digestion with the restriction endonucleases Hha I and Hinf I. 50 bp ( l ) and 100 bp (L) DNA ladders are also shown.

