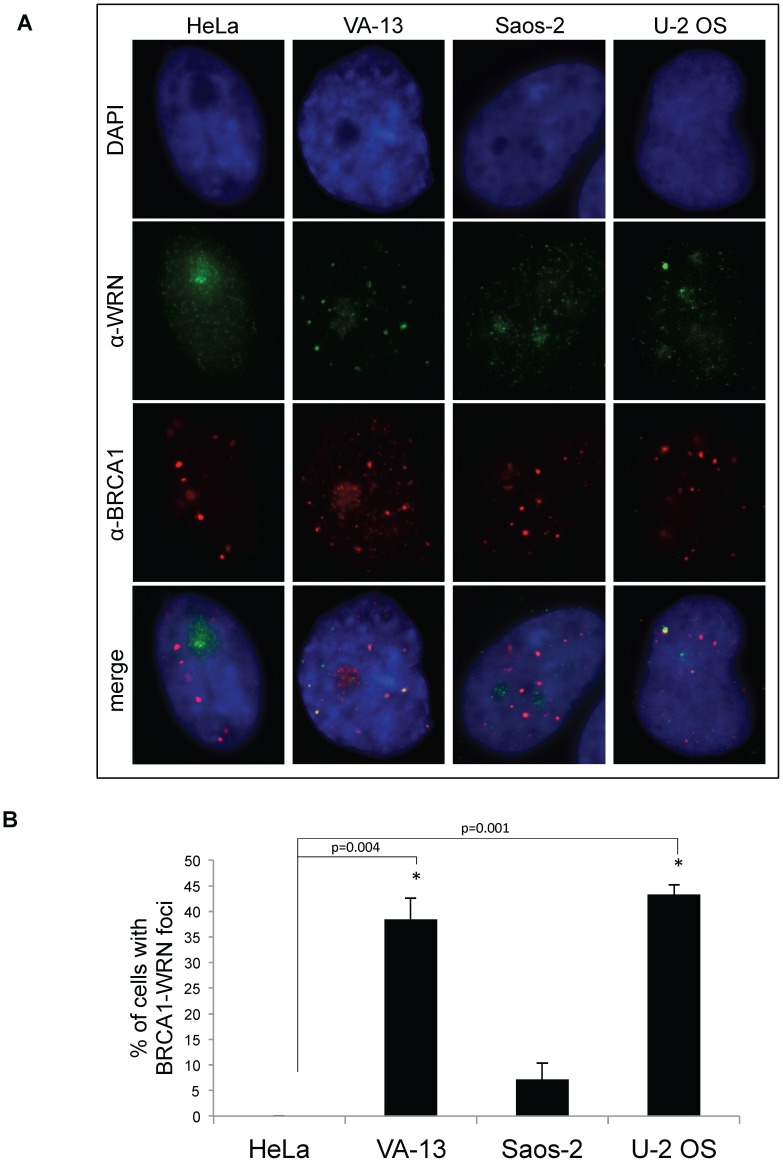
Figure 7. Immunofluorescence of WRN and BRCA1 in telomerase-positive and ALT cells.
A. Representative micrograph images of cells from the telomerase-positive cell line HeLa and three ALT cell lines, VA-13, Saos-2 and U-2 OS. Cells were fixed and immunofluorescently labeled with antibodies to BRCA1 (red) and WRN (green), and the nucleus is stained with DAPI (blue). B. A graphical representation of at least three independent experiments averaged to yield the percentage of each cell type with co-localized BRCA1-WRN foci.

