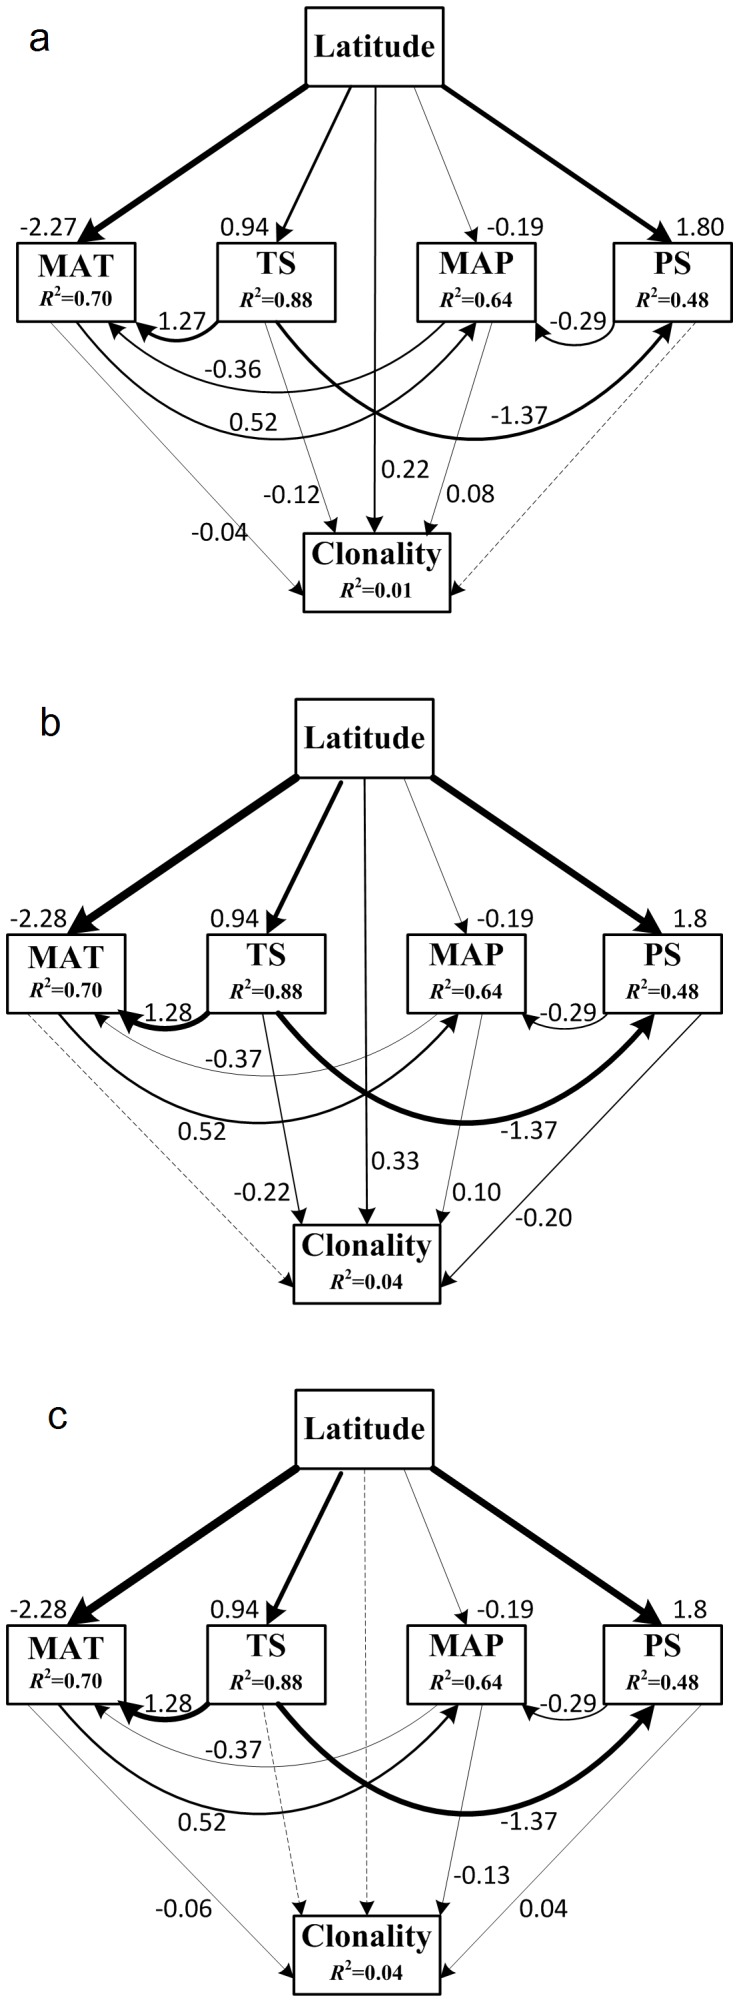
Figure 4. Structural equation models for variation of clonality.

Non-significant paths are indicated by dotted arrows. The thickness of the solid arrows reflects the magnitude of the standardized SEM coefficients. Standardized coefficients are listed beside each significant path, as is the variance explained (R 2) for each endogenous variable. a: all species; b: within woody species; c: within herbaceous species.
