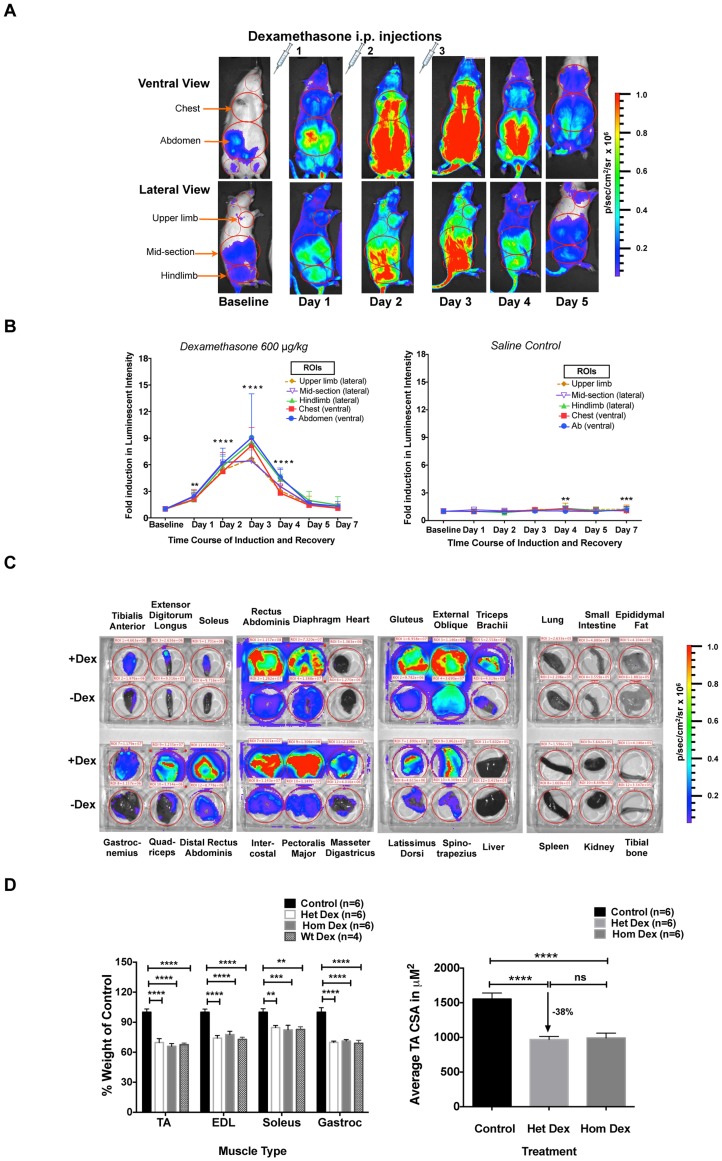
Figure 2. Time course of the MuRF1-hiLUCs reporter induction and extent of muscle atrophy following dexamethasone treatment.
(A) MuRF1-hiLUCs reporter rats were given either 600 ug/kg of dexamethasone or saline via i.p. for three consecutives days. In vivo images of ventral and right lateral views were acquired before treatments (baseline) and then daily thereafter, starting 24 hours after the first dose, until day 7. Shown are the ventral and lateral images of a representative rat from day 1- day 5. (B) Quantitation of the fold induction of luminescent intensity of the MuRF1-hiLUCs reporter during the time course of the dexamethasone (n = 10 for day 1–5, n = 9 for day 7) or saline (n = 8) treatment. Five distinct ROIs were chosen for the quantitation. Fold inductions were calculated over baseline values. Data are presented as means (symbols) + SEM (lines). Statistics were performed using ordinary two-way ANOVA with Dunnett's multiple comparisons test. *P<0.05, **P<0.01, ***P<0.001, ****P<0.0001. (C) Induction of the MuRF1-hiLUCs reporter in dissected skeletal muscles after dexamethasone treatment. MuRF1-hiLUCs reporter rats treated identically as indicated above but then sacrificed on day 3, one day after the last dosing. Skeletal muscles and otherwise indicated tissues were dissected out immediately after the luciferin injection and placed in a 6-well dish for visualization. The experiment shown is representative of three independent experiments. (D) Quantitation of the extent of hindlimb muscle atrophy in MuRF1-hiLUCs reporter rat after 7 days of dexamethasone treatment. All muscle weights were normalized to body weights and presented as percent of normalized muscle weights from control rats. CSA analysis for the tibialis anterior muscle was performed as described in the methods. Data are presented as mean (symbols) + SEM (lines). Statistics were performed using one-way or 2way ANOVA with Tukey's multiple comparisons test. **P<0.01, ***P<0.001, ****P<0.0001.

