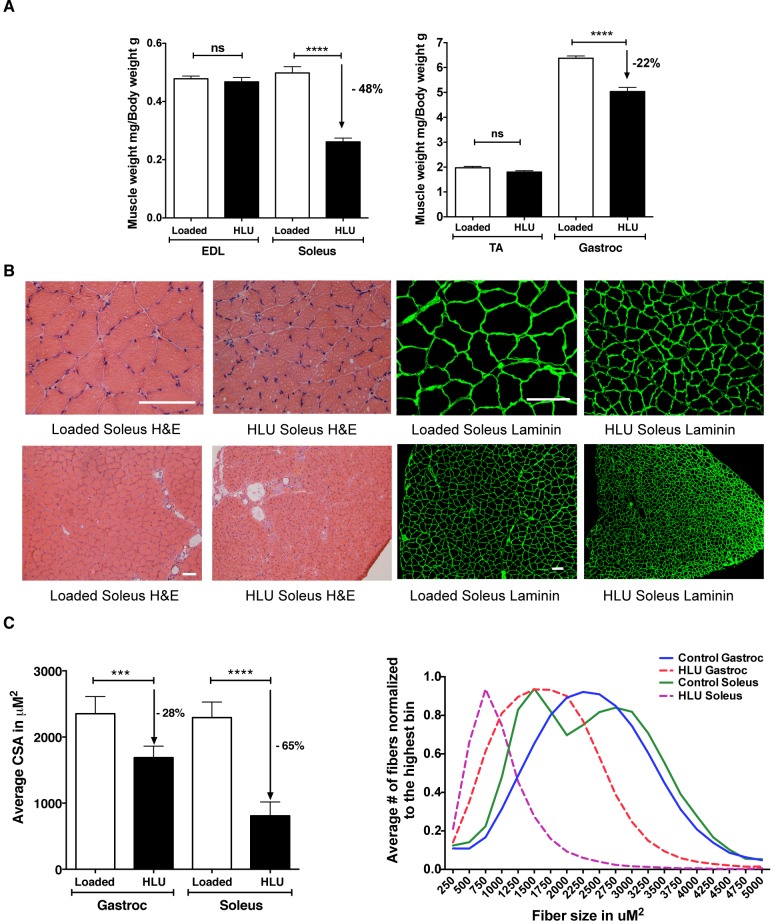
Figure 6. Extent of muscle atrophy in hindlimb unloaded vs. control rats after 14 day of HLU.
(A) Hindlimb muscles were harvested on day 14 from unloaded (n = 8) or loaded control (n = 6) MuRF1-hiLUCs reporter rats. Muscle weights were normalized to body weights. Data are presented as means (symbols) + SEM (lines). Statistics were performed using unpaired, two-tailed t test. ****P<0.0001. (B) Histological analyses of the hindlimb muscles from 14-day HLU rats vs. loaded control rats. Both H&E and laminin staining showed dramatic reductions in the CSA of the HLU vs. the control soleus muscles. Scale bars: 100 uM. (C) Comparison of the average CSA and fiber size distribution of the HLU vs. the loaded control soleus and gastrocnemius muscles. CSA analysis was performed using an internally developed algorithm as described in the methods. An average of 57,000 fibers (6 cross-sections) were analyzed for each gastrocnemius muscle and 3600 fibers (6 cross-sections) were analyzed for each soleus muscle. Statistics were performed using ordinary one-way ANOVA with Sidak's multiple comparisons test. ***P<0.01, ****P<0.0001.

