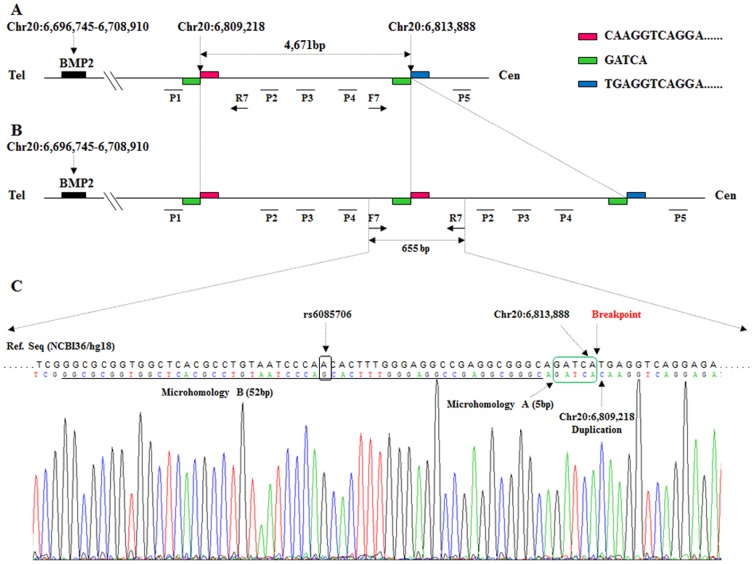
Figure 4. Results of long PCR, breakpoint identification, and positions of primers used.
A. Structure of duplicated region in the unaffected members. F7 and R7: primers used in the breakpoint identification. P1–P5 are the primer positions used in the Q-PCR. The red and green bars indicate the breakpoint region. The numbers above the BMP2 denote the genomic position. Tel: telomere; Cen: centromere. B. Structure of duplicated region in patients. The duplicated region is between Chr20: 6,809,218 and 6,813,888. PCR using primers F7 and R7 amplified the 655 bp sequences spanning the breakpoint. C. Sequencing results of the breakpoint PCR product. The nucleotides of microhomology A (5 bp) are marked by a green box, and the nucleotides of upstream microhomology B (52 bp), including the rs6085706 SNP, are underlined. In addition, the microhomologous nucleotides GTGACC (7 bp) [22] and TTGCAGTGAGC (11 bp) [23] reported previously were also observed downstream of microhomology A (data not shown).

