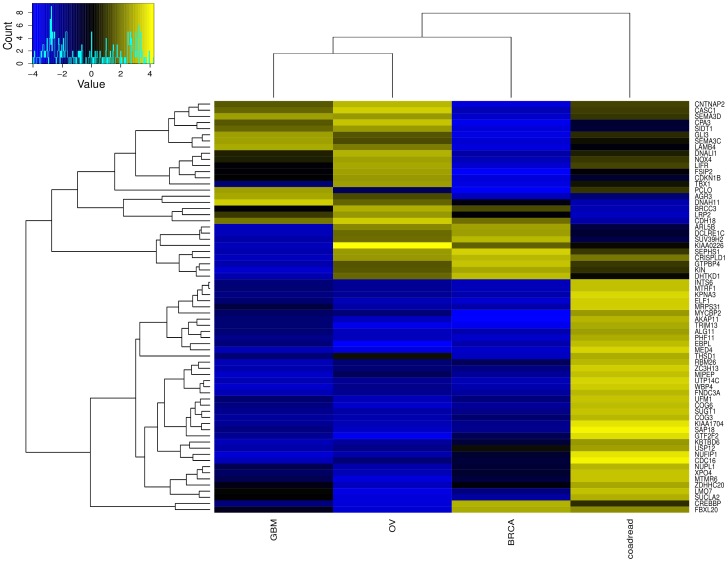
Figure 5. Genes classified as oncogenes and suppressors in different tumor types.
Genome-wide analysis of genes behaving as tumor suppressor in one tumor type and oncogene in a different tumor type. Sixty-seven genes with S-score<−2.5 in one tumor type and S-score >2.5 in a different tumor type were selected and a heatmap showing their S-score for all tumor types is presented. Blue represents negative S-scores while yellow represents positive S-score.

