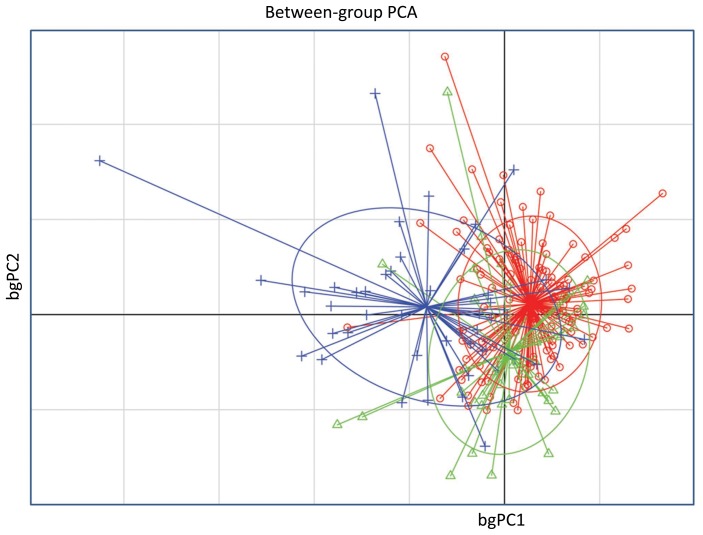
Figure 2. Between group principal component analysis (bgPCA) of the angular measurements.
Humans (•) and bonobos (▴) were very closed to each other and distant from chimpanzees (+). The ellipses graphically represent the scatter plots encompassing approximately 67% of the subjects. The bgPCA showed a strait overlap of humans with bonobos and a weaker overlap of the latter two species with the chimpanzees.

