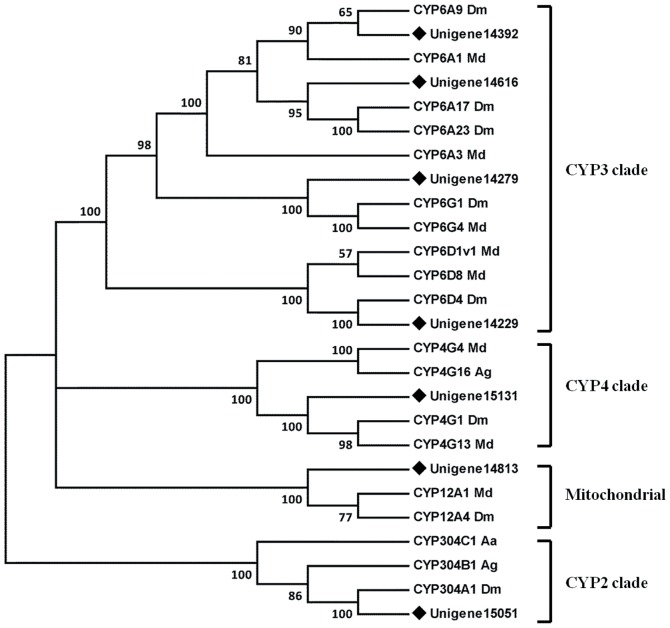
Figure 7. Phylogenetic analysis of cytochrome P450s from Bactrocera dorsalis (Bd), Drosophila melanogaster (Dm), Musca domestica (Md), Anopheles gambiae (Ag) and Aedes aegypti (Aa).
The tree was created using the neighbor-joining method. Bootstrap values represent the percentage of 1000 replicates. Reference sequences were obtained from the NCBI database.

