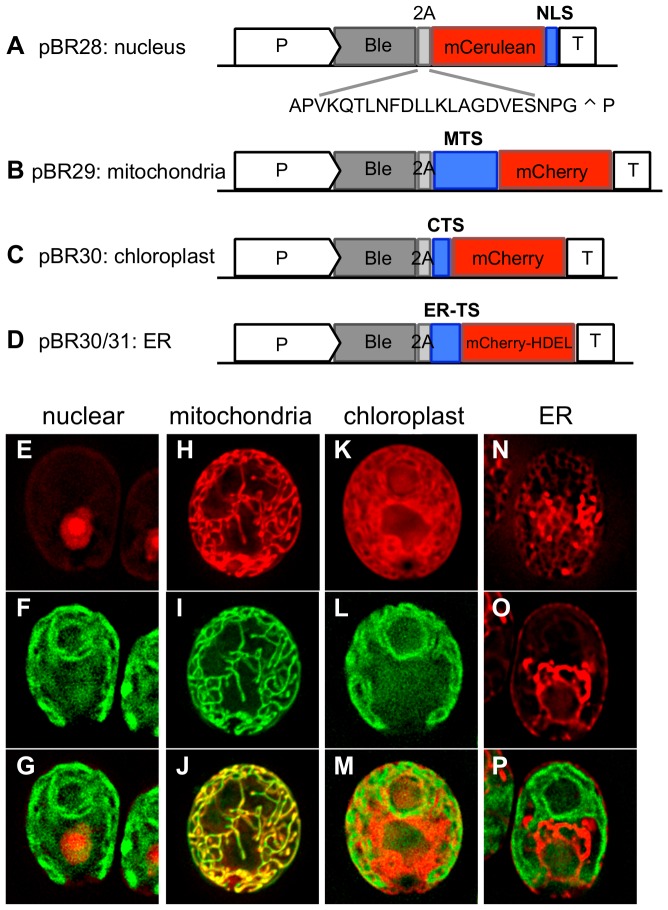
Figure 1. Chlamydomonas transformation vectors for protein targeting to specific subcellular locations.
A–D. Schematic representation of Chlamydomonas targeting vectors. All transformation vectors contain the hsp70/rbcs2 promoter (P), the ble gene that confers resistance to zeocin, the 2A self-cleaving sequence from foot-and-mouth-disease virus, and the rbcs2 terminator (T). The site of cleavage is indicated with an arrowhead. A. pBR28, mCerulean is targeted to the nucleus by a C-terminal fusion to 2xSV40 NLS. B. pBR29, mCherry is targeted to the mitochondria by an N-terminal fusion to the mitochondrial transit sequence (MTS) of mitochondrial atpA. C. pBR32, mCherry is targeted to the chloroplast using the chloroplast transit sequence (CTS) from psaD. D. pBR30/31, mCherry is targeted to the ER using the ER-transit sequence (ER-TS) from either BiP1 or ars1. The ER retention sequence H-D-E-L is fused to the C-terminus of mCherry. E–P. Microscopy images of cells transformed with pBR28 (E–G), pBR29 (H–J), pBR32 (K–M), and pBR30 (N–P). Top row are live cell images of the fluorescent proteins targeted to the nucleus (E), mitochondria (H), chloroplast (K) or ER (N, O). (I) The cell is co-stained with the mitochondrial dye Mitotracker. (N) Cross section through the top of a cell expressing mCherry in the ER allows for the visualization of the cortical ER network. (O) Cross section through the middle of the same cell as in (N). The chloroplast membranes are visualized in (F), (L) and (P). Merged images are shown in the bottom row.

