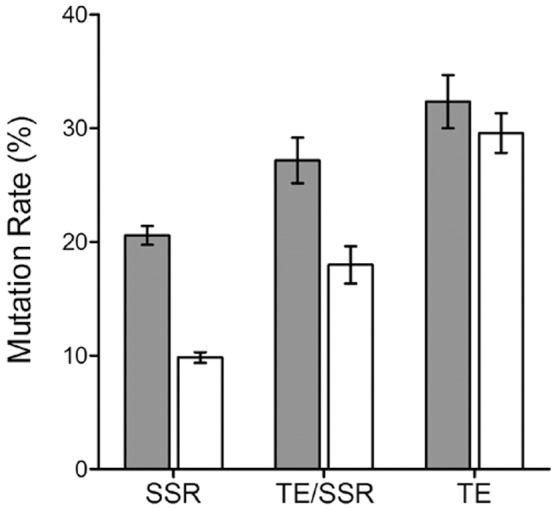
Figure 2. Stress induced genetic variations based on repetitive DNA elements.

Mutation rates for transposable elements (TEs) were compared with simple sequence repeats (SSR) and TE/SSR regions. Mutation rates were calculated based on number of altered DNA bands generated in stress exposed samples as compared to control. Gray and white bars represent mutation rates determined for heat shock and copper stress exposed samples respectively. All the dataset are analyzed with two-way analysis of variance (ANOVA) with Bonferroni post-tests. Results were found extremely significant at p<0.0001. Data are presented as means ± standard error mean (SEM).
