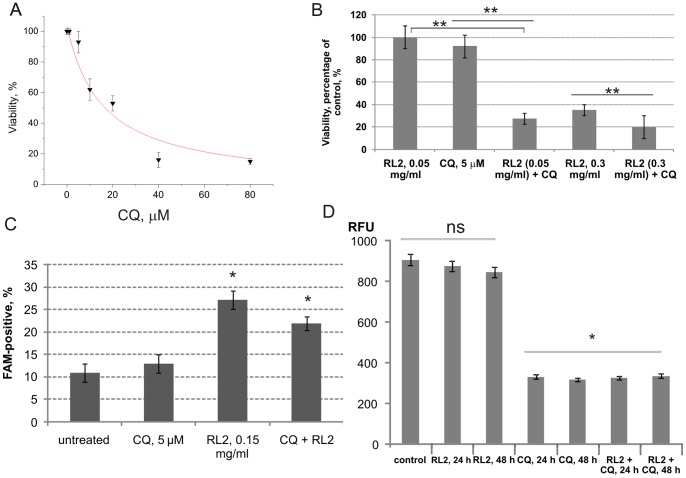
Figure 6. Enhanced cytotoxic outcome in combination of RL2 with CQ.
MDA-MB-231 cells were used as a model. A. Dose-dependence of CQ cytotoxicity was calculated using MTT data of three independent experiments. Shown are mean values ± SD. B. Cells were treated with different concentrations of RL2 in the presence or absence of CQ, and after 48 h cell viability was measured by MTT assay. C. Cells were incubated with RL2 (0.2 mg/mL), CQ (5 μM) or a combination for 24 h and the percentage of cells with active caspase -3,-7 was analysed using flow cytometry. Shown are mean values ± SD of three independent experiments. The asterisks indicate significant difference from control (*, p<0.05). D. Cells were incubated with RL2 (0.2 mg/mL), CQ (5 μM) or a combination for 24–48 h. Cathepsin D activity was analysed using a fluorescence substrate (labeled with methyl cumaryl amide) by fluorimetry as described in ‘Materials and methods’ section. RFU – relative fluorescence units per microgram protein of sample. Shown are mean values ± SD of three independent experiments. The asterisks indicate significant difference between indicated groups (**, p<0.05), ns - not significant difference between groups (p>0.05).

