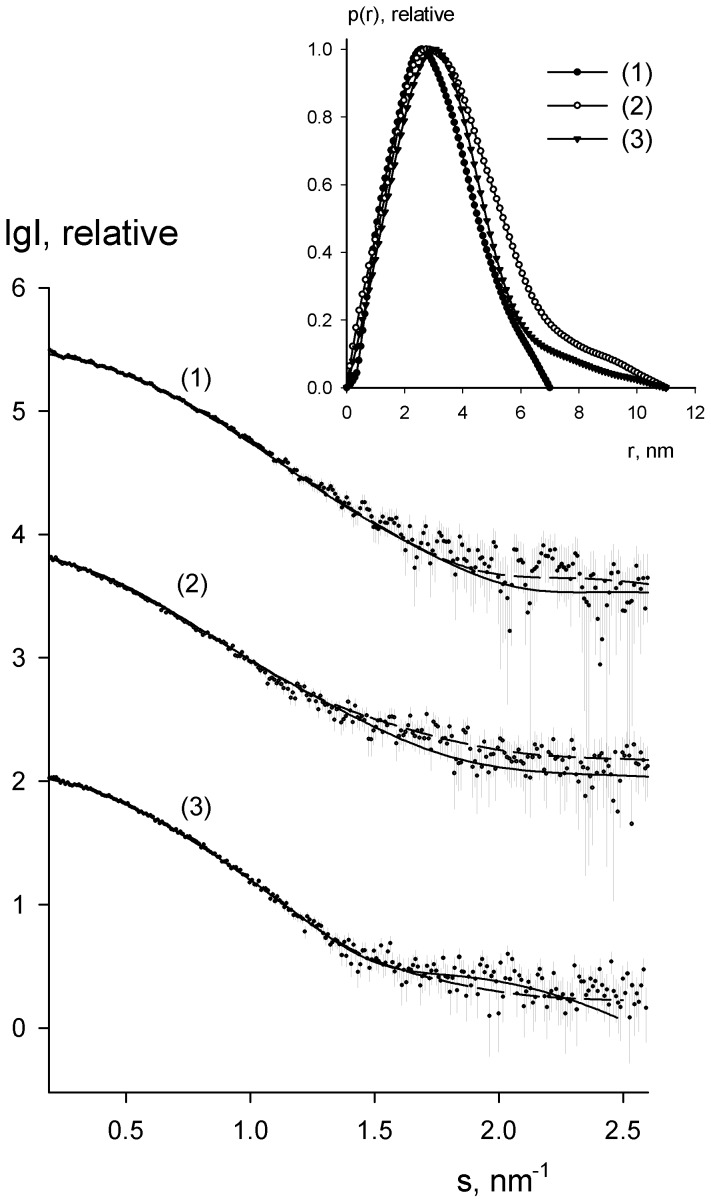
Figure 1. The experimental X-ray scattering data and the obtained fits.
Curves 1–3 correspond to M.NlaX, M.SsoII and M.SsoII–15met complex,respectively. Experimental data are displayed as dots with error bars, the scattering from the typical ab initio models computed by DAMMIN or MONSA as full lines, and the calculated fits by CRYSOL (M.NlaX) or EOM (M.SsoII and the complex) as dashed lines. The plots display the logarithm of the scattering intensity as a function of momentum transfer. The distance distribution functions are presented in the insert.

