
Figure 1.
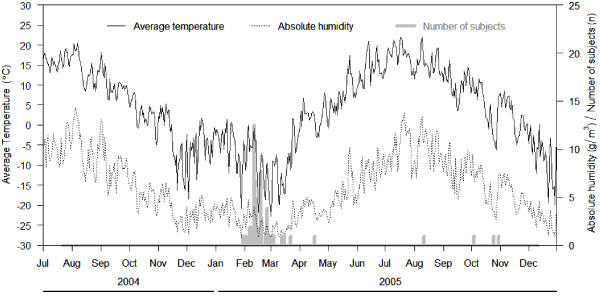
Incidence of influenza episodes, mean daily temperature (°C) and mean daily absolute humidity (AH) (g/m 3 ) during the study period.
Official websites use .gov
A
.gov website belongs to an official
government organization in the United States.
Secure .gov websites use HTTPS
A lock (
) or https:// means you've safely
connected to the .gov website. Share sensitive
information only on official, secure websites.
Incidence of influenza episodes, mean daily temperature (°C) and mean daily absolute humidity (AH) (g/m 3 ) during the study period.