
Figure 3.
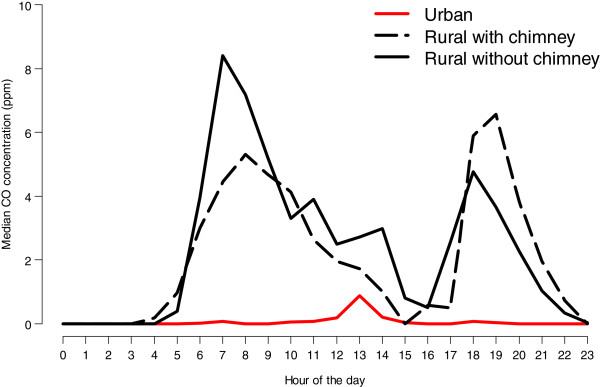
Median indoor CO concentrations by hour of the day. Curves are stratified by site and chimney construction (urban, rural with chimney, and rural without chimney). The y-axis represents median values of indoor CO (ppm) across households. We calculated these household summaries for each hour of the day, as indicated on the x-axis.