
Table 4.
Comparative mean bonding strength under the two-way ANOVA using the main effect model (no-interaction model, incorrect†, g-2)
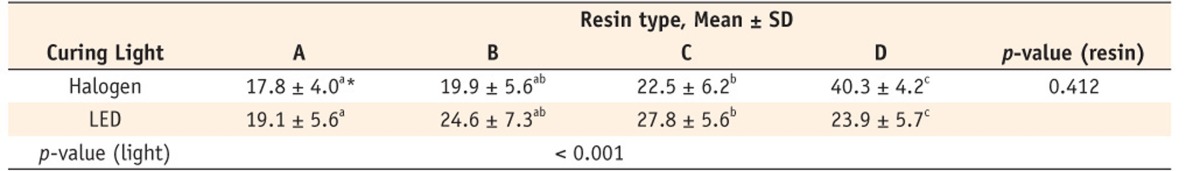
†This table simply shows how to report results of the main effect model, only for the purpose of illustration. Actually the Table 3 displays the correct results which reflect given data well.
*Different alphabets mean significantly different values at a type one error rate of 0.05.
p-value (model) < 0.001; R-square = 0.35.