
Figure 3. The effects of maternal obesity on TAC and FoxO4 cellular localization in placenta.
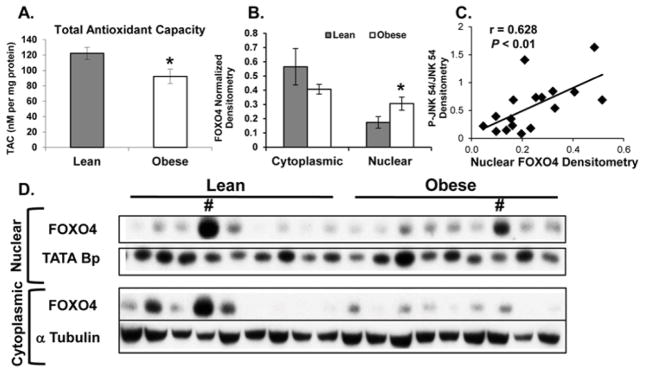
A: Total antioxidant capacity (TAC) analysis of term placenta from lean and obese women (12-lean and 12-obese). TAC was normalized to total protein and expressed as nM TAC per mg protein. B and D: Western blot (D) and densitometric analysis (B) of FoxO4 levels in the nuclear and cytoplasmic fractions isolated from 8-lean and 8-obese placenta. (#) Represents statistical outliers that were removed from the analysis. Values are expressed as means ± SE. C: Correlations between the densitometry values for placental activated JNK (obtained from our previous publication [13]) and nuclear FoxO4. r = Pearson’s correlation coefficient, where a positive value indicates a positive relationship. Statistical significance was determined when P < 0.05 (*).