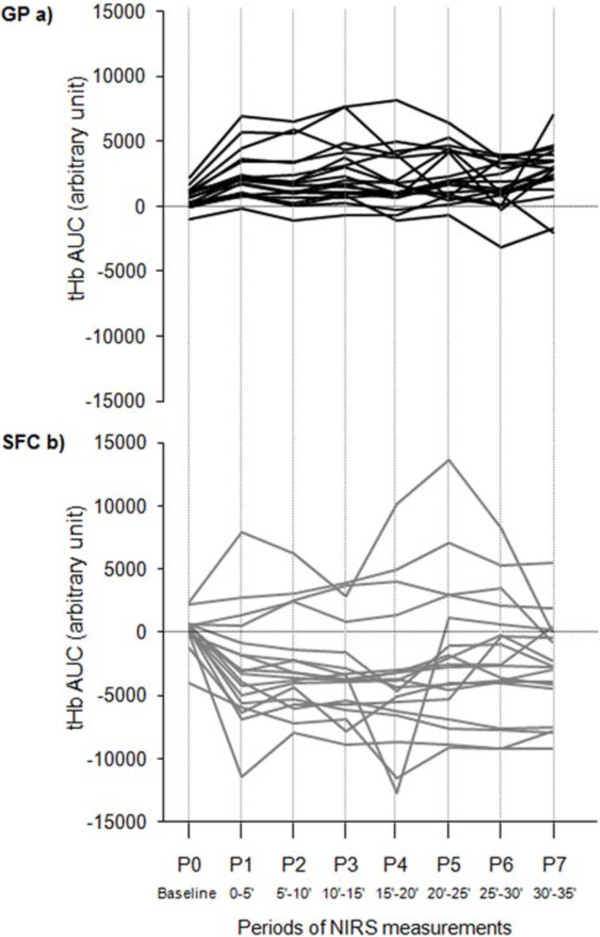
Figure 4.
tHbAUC changes for each single leg under study during the treatment with the two devices. Legend to Figure 4: a) GP, Gradient Pump device; b) SFC, sequential foot-calf device; tHbAUC, area under curve of total haemoglobin. The continuous lines connect tHbAUC values recorded each 5-minute period during the treatment (P1-7) starting from baseline (P0). Data refer to 12 patients/20 diseased legs for GP device, and 11 patients/18 diseased legs for SFC device.

