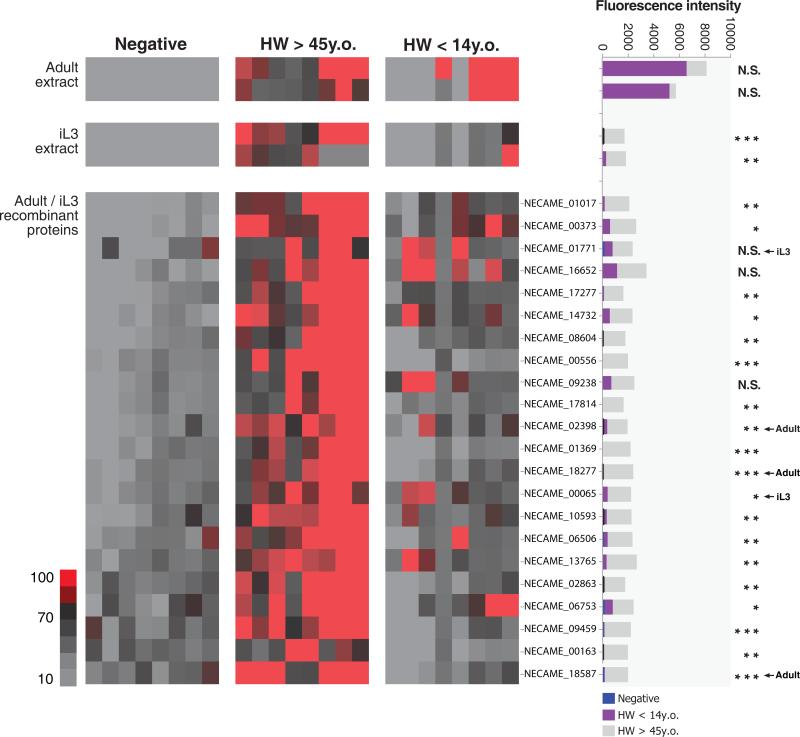
Figure 4. The serum responses to Necator americanus antigens vary with age and infection intensity.
The heat map shows the immunoreactivity of 22 antigens to the IgG antibodies from groups of uninfected individuals, infected children (HW <14 y.o.) and infected adults (HW >45 y.o.)[n=8 in each group]. Duplicate crude somatic extracts from iL3 and adult stage were included as control naive antigens; Every other row represents an individual recombinant in vitro translation product. The stacked bar plot represents the mean immunoreactivity for each antigen for the three groups based on mean fluorescence intensity. Highlighted “iL3” or “Adult” indicates corresponding stage-specific expression based on RNA-seq data. Significant differences in antibody responses between adult and children group were detected using student t test [P<0.05 (*); P<0.01 (**); P<0.001 (***); N.S., no significant difference].

