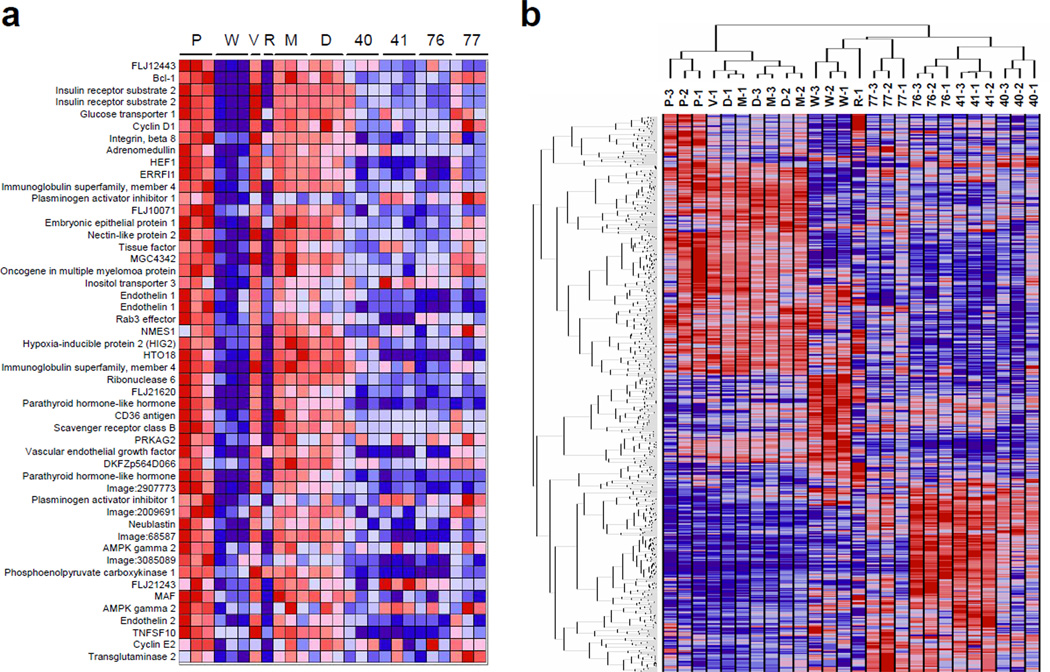
Figure 2. Gene expression profile of compound treated 786-O cells.
For all panels, the cell lines used were: P, PRC3; W, WT8; V, pTV; R, pTR; or parental 786-O cells treated with M, medium only; D, DMSO; or compounds 40, 41, 76 and 77 as indicated, at the experimentally determined IC50 concentrations (a) Identified compounds coordinately downregulate HIF target genes. The genes illustrated are the top 50 markers of 786-O derived vector only (P for PRC3) cells relative to matched isogenic VHL-reconstituted (W for WT8) cells, which are also downregulated by the HIF-2a-targeting shRNA (R for pTR) cells relative to an empty vector control (V for pTV) cells. (b) Hierarchical clustering of samples and genes reveals similarities between the activities of compounds. Samples were clustered in the space of 800 genes comprised of the 100 genes most powerfully upregulated and the 100 genes most powerfully downregulated in cells treated with compounds, and in PRC3 versus WT8 cells.

