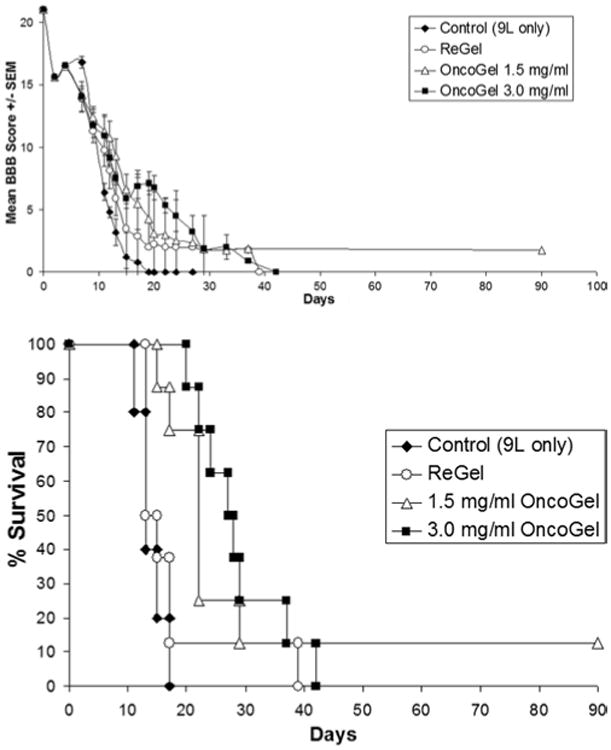
Fig. 3.

Graphs of the delayed treatment (Day 5) against an established tumor study showing BBB score progression over time (upper) and Kaplan-Meier survival curves (lower) in each group.

Graphs of the delayed treatment (Day 5) against an established tumor study showing BBB score progression over time (upper) and Kaplan-Meier survival curves (lower) in each group.