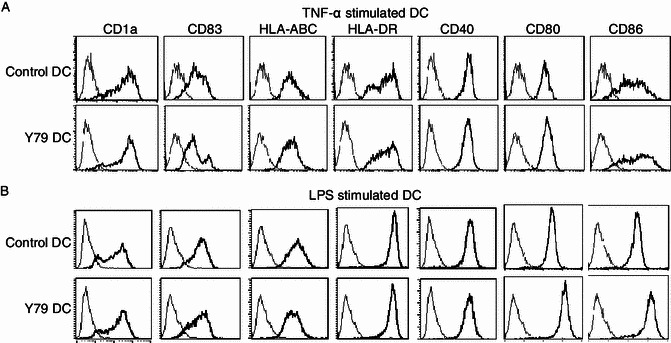
Figure 2.

Expression of DC markers, MHC and co-stimulatory molecules in RBcs-exposed DC. Control DCs or RBcs-exposed DCs were treated with 20 ng/mL TNF-α (A) or 1 μg/mL LPS (B) for 24 h. The cells were then harvested for immunofluorescence staining and flow cytometry. Bold lines denote fluorescence when stained with fluorochrome-conjugated antibody to the indicated antigen, and fine lines denote fluorescence when stained with isotype control mAb. Data shown are a representative experiment of five. Y79 DC: RBcs-exposed DCs
