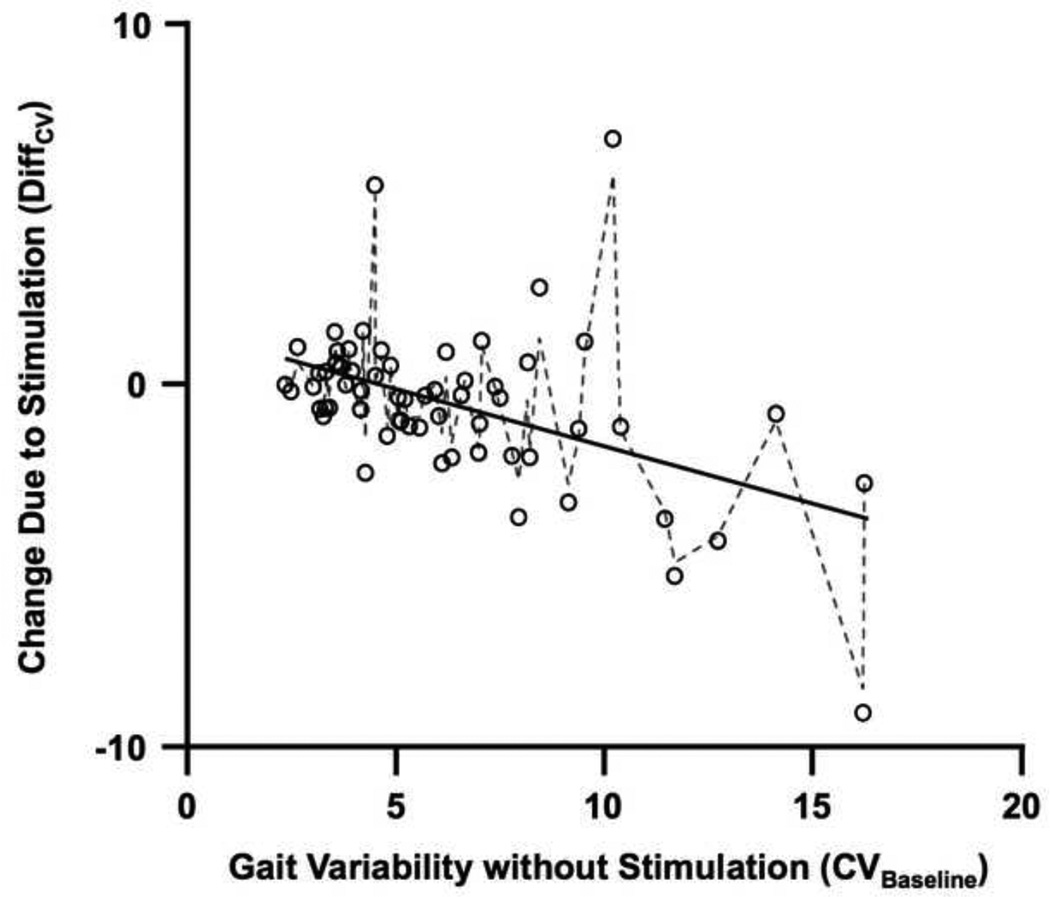
Figure 2.
Plot illustrating measured changes in stride-to-stride variability due to SR mechanical stimulation (DiffCV; circles) as well as values of DiffCV predicted by Model 2 (lines) along measured values of baseline stride-to-stride variability (CVBaseline). The solid line indicates values predicted by fixed effects only and the dashed line indicates the values predicted by the combination of fixed and random effects. Greater baseline stride-to-stride variability increases towards the right on the x-axis. Change in stride-to-stride variability is indicated by values of DiffCV below 0 on the y-axis. This plot pools information for both step-width and stride-length variability.

